

Data Visualization | Website Design | Illustration

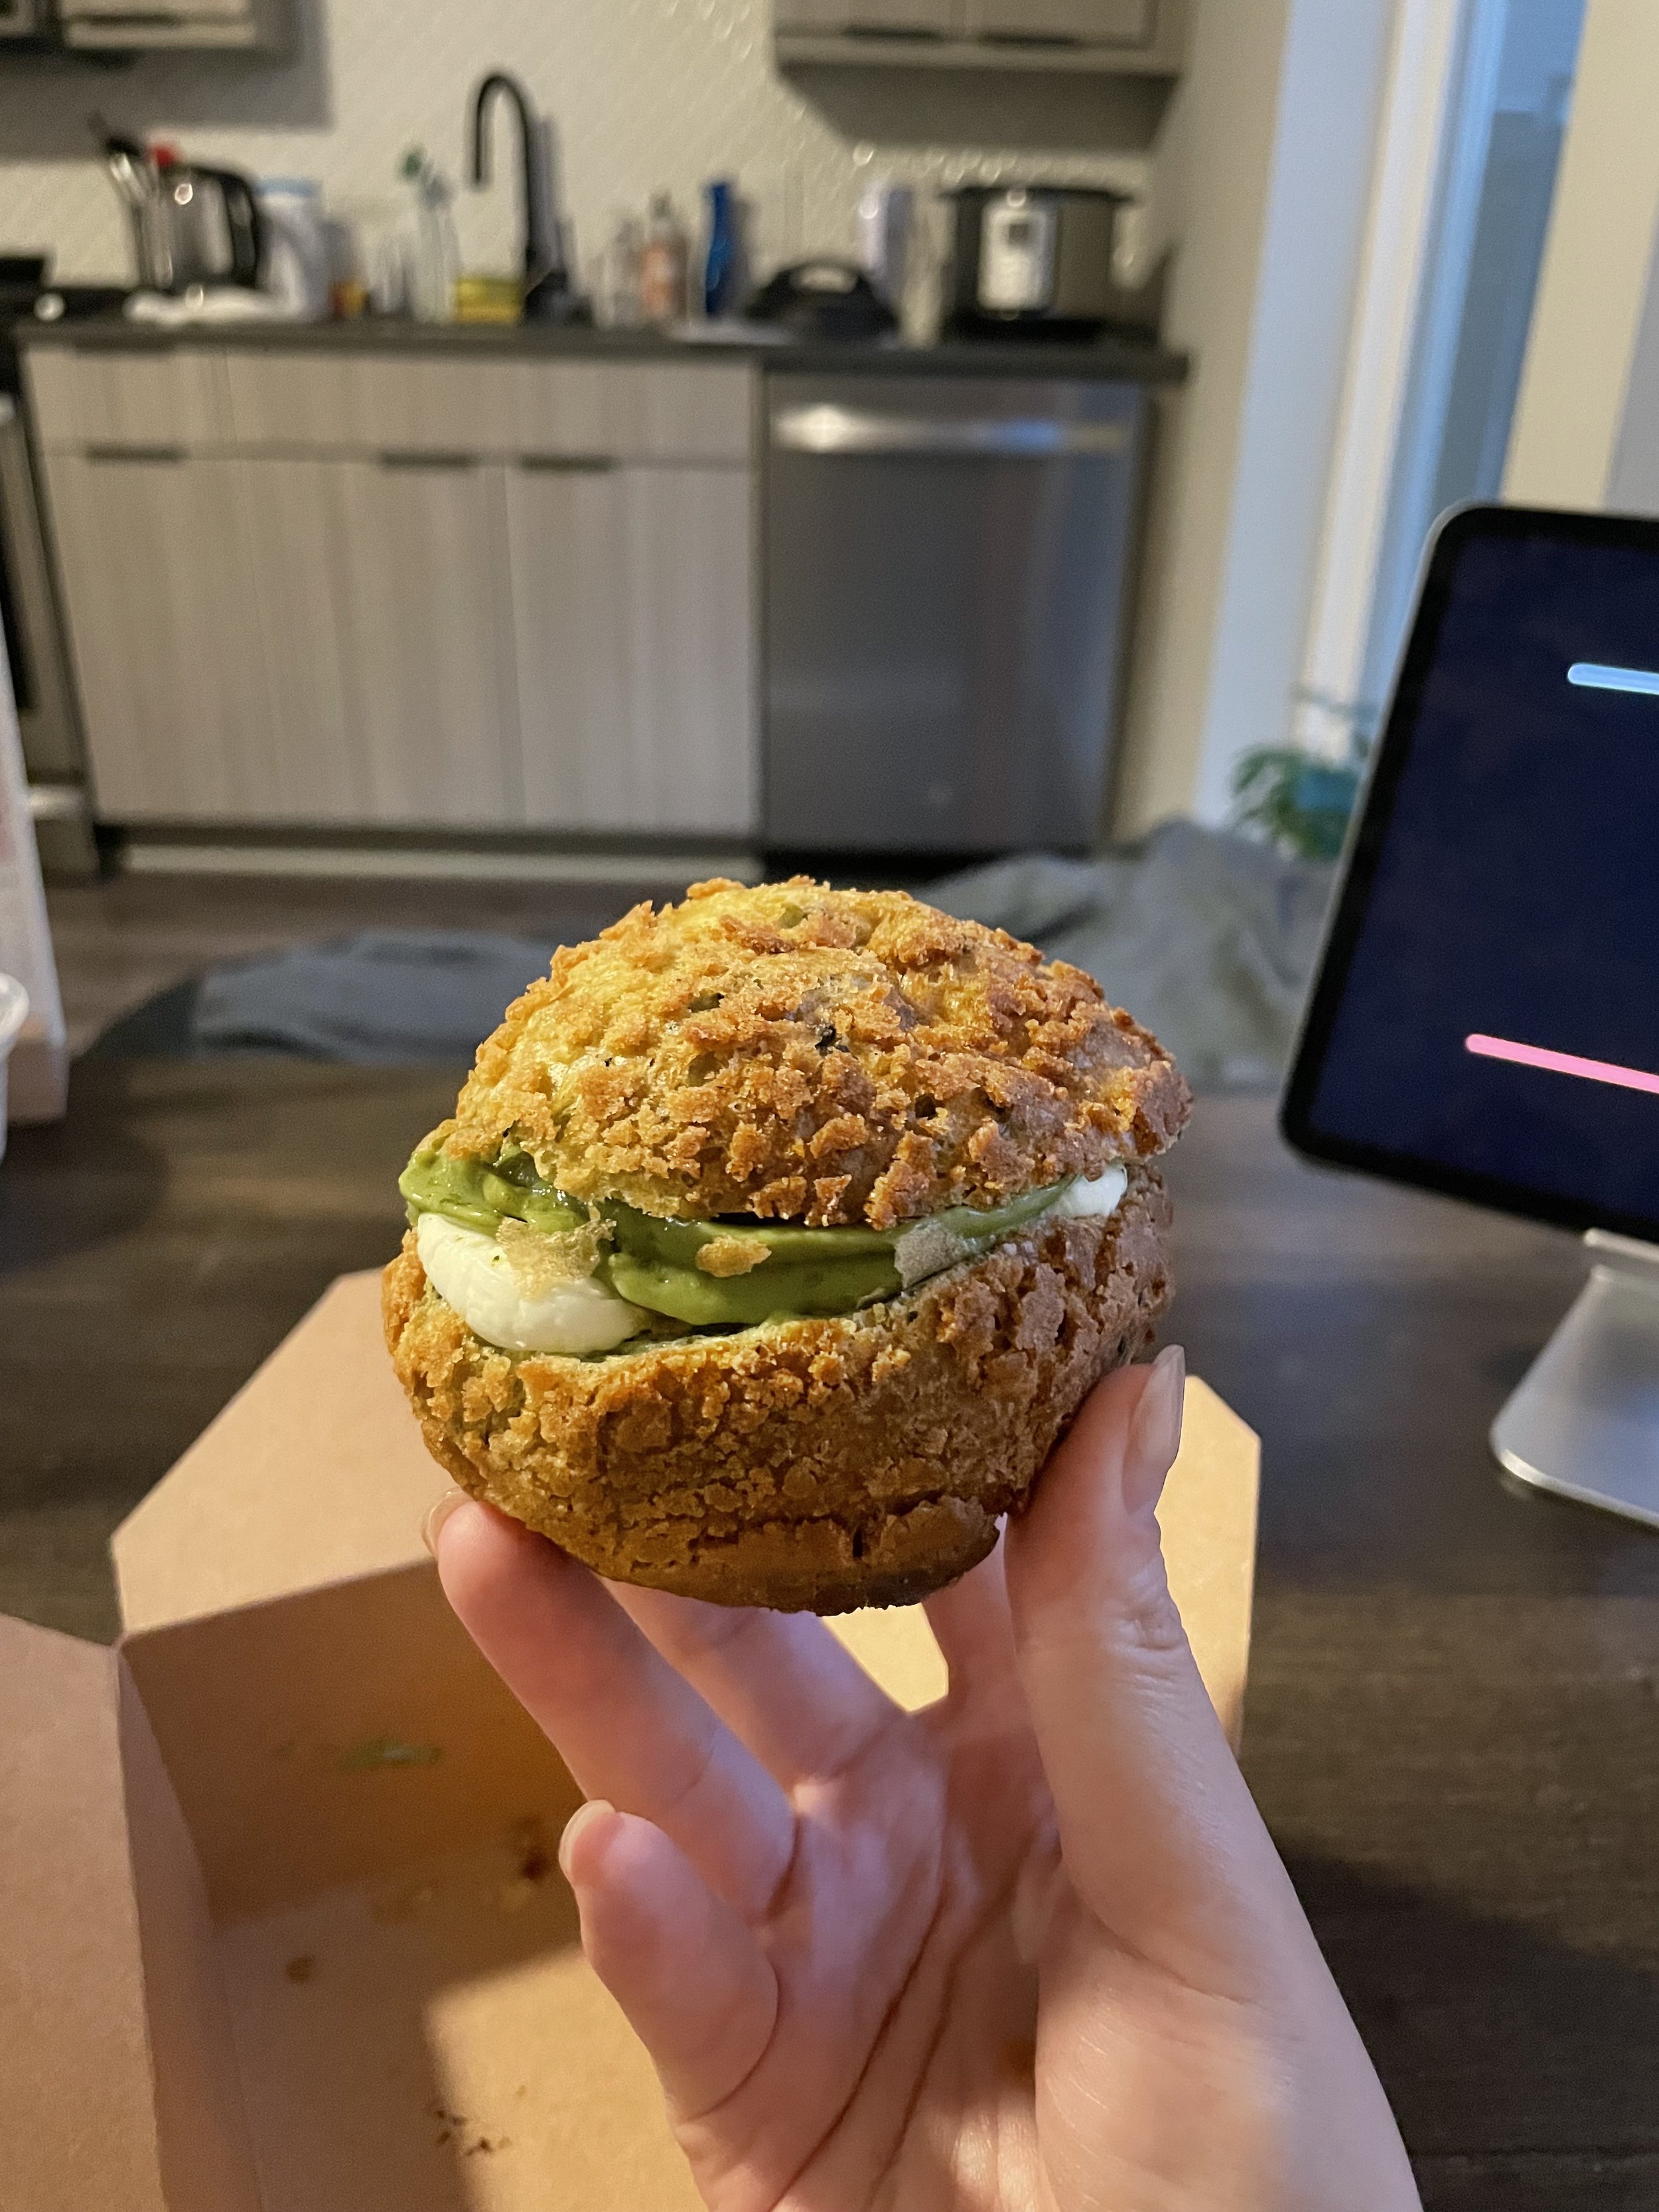
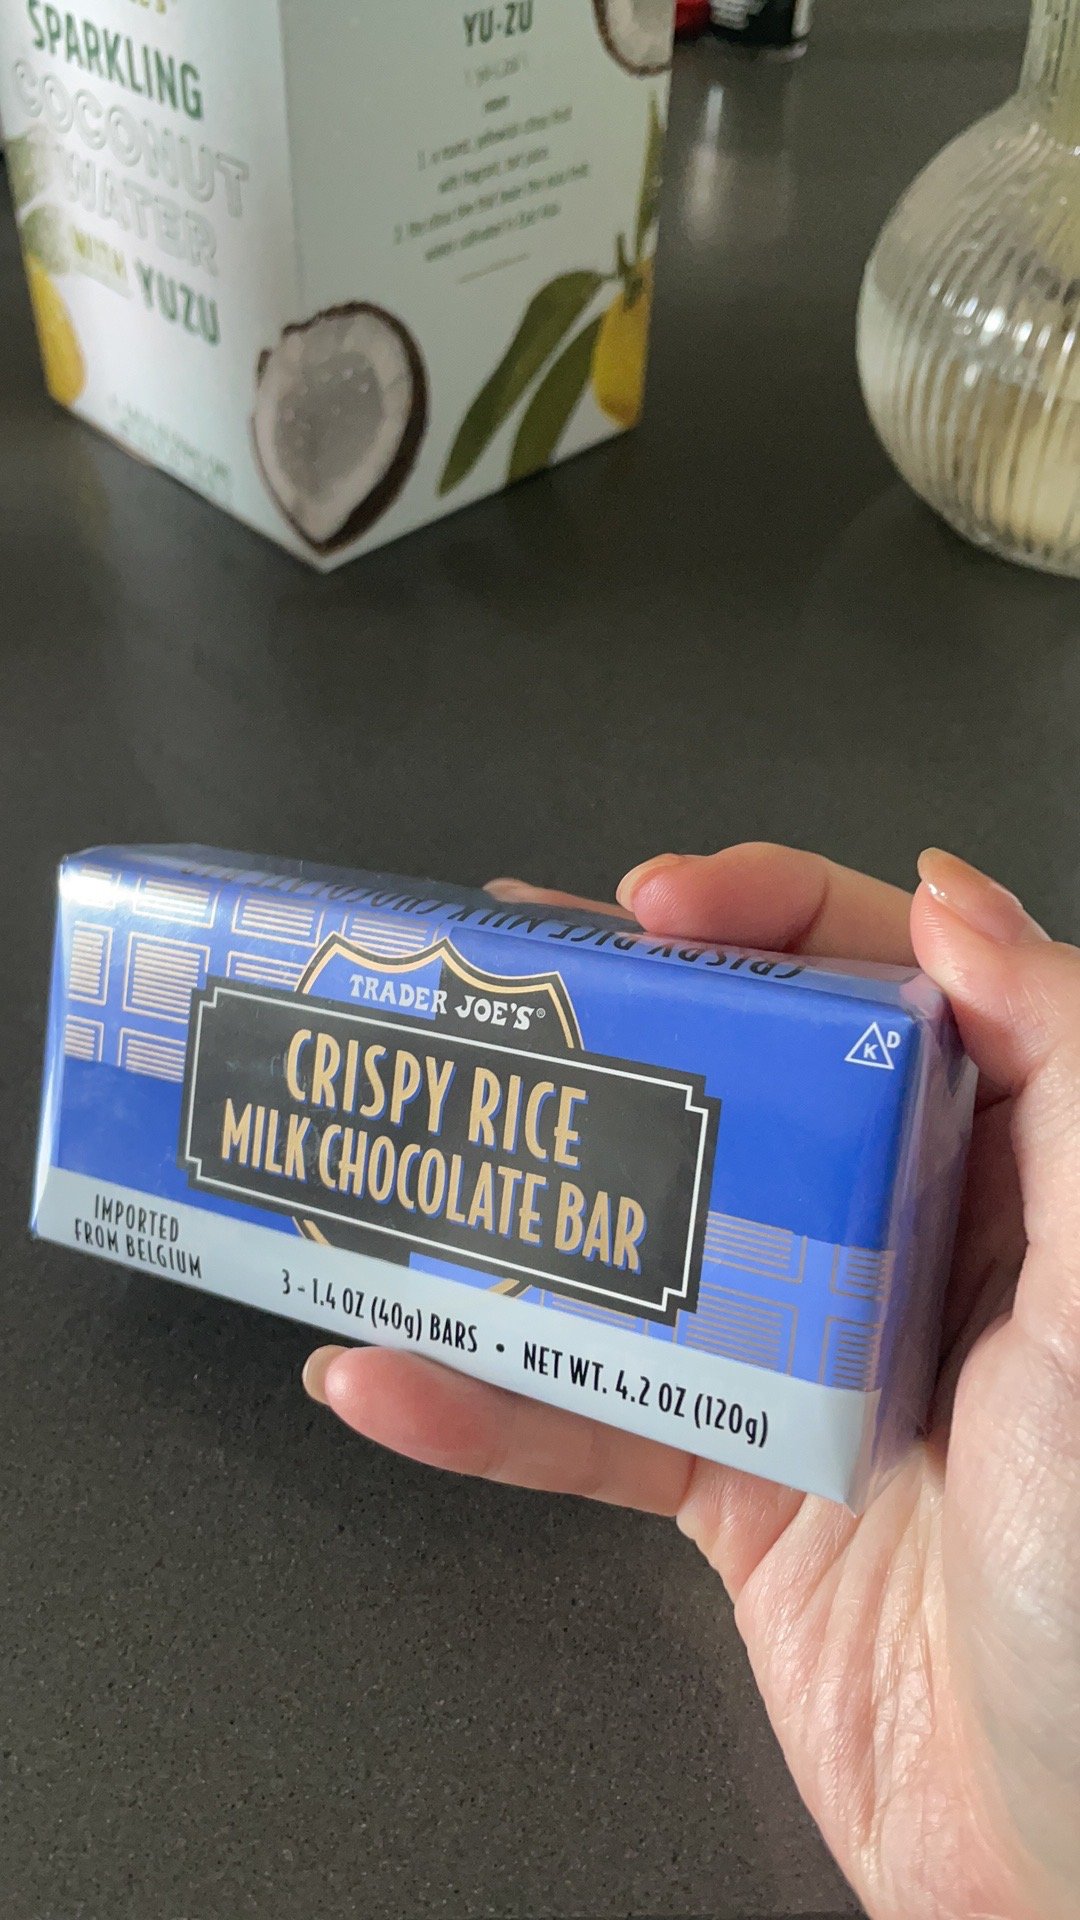
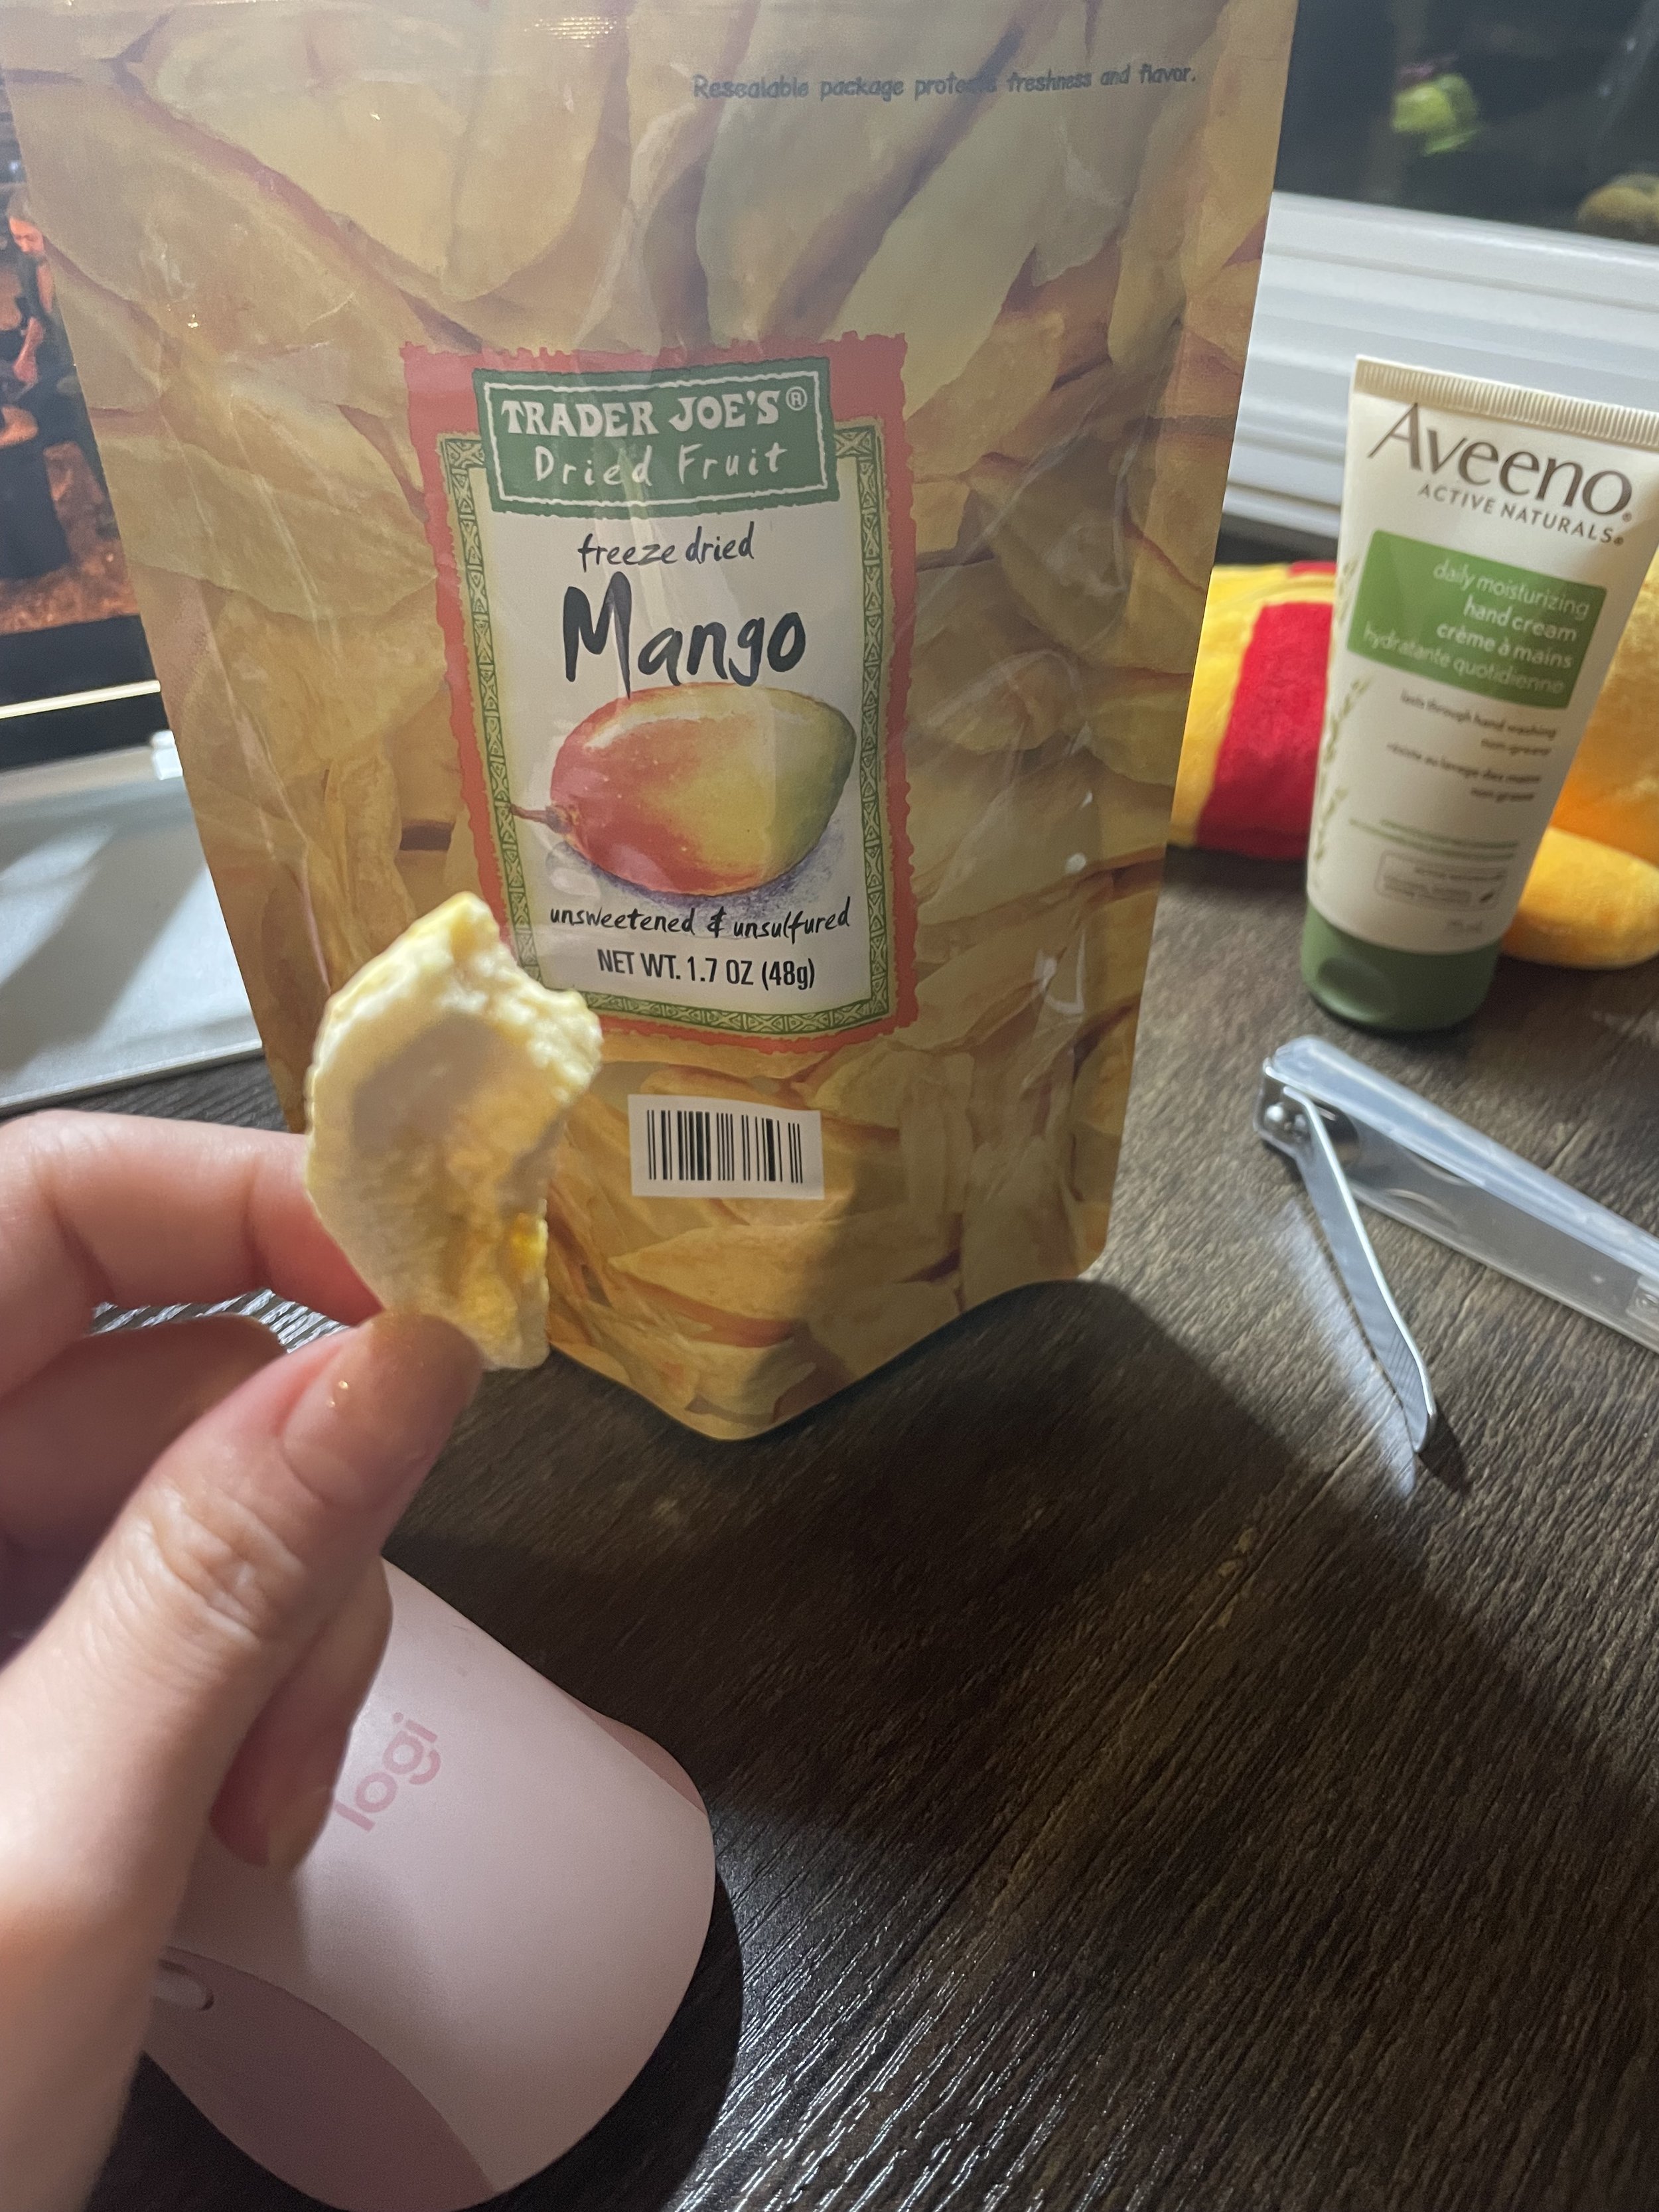
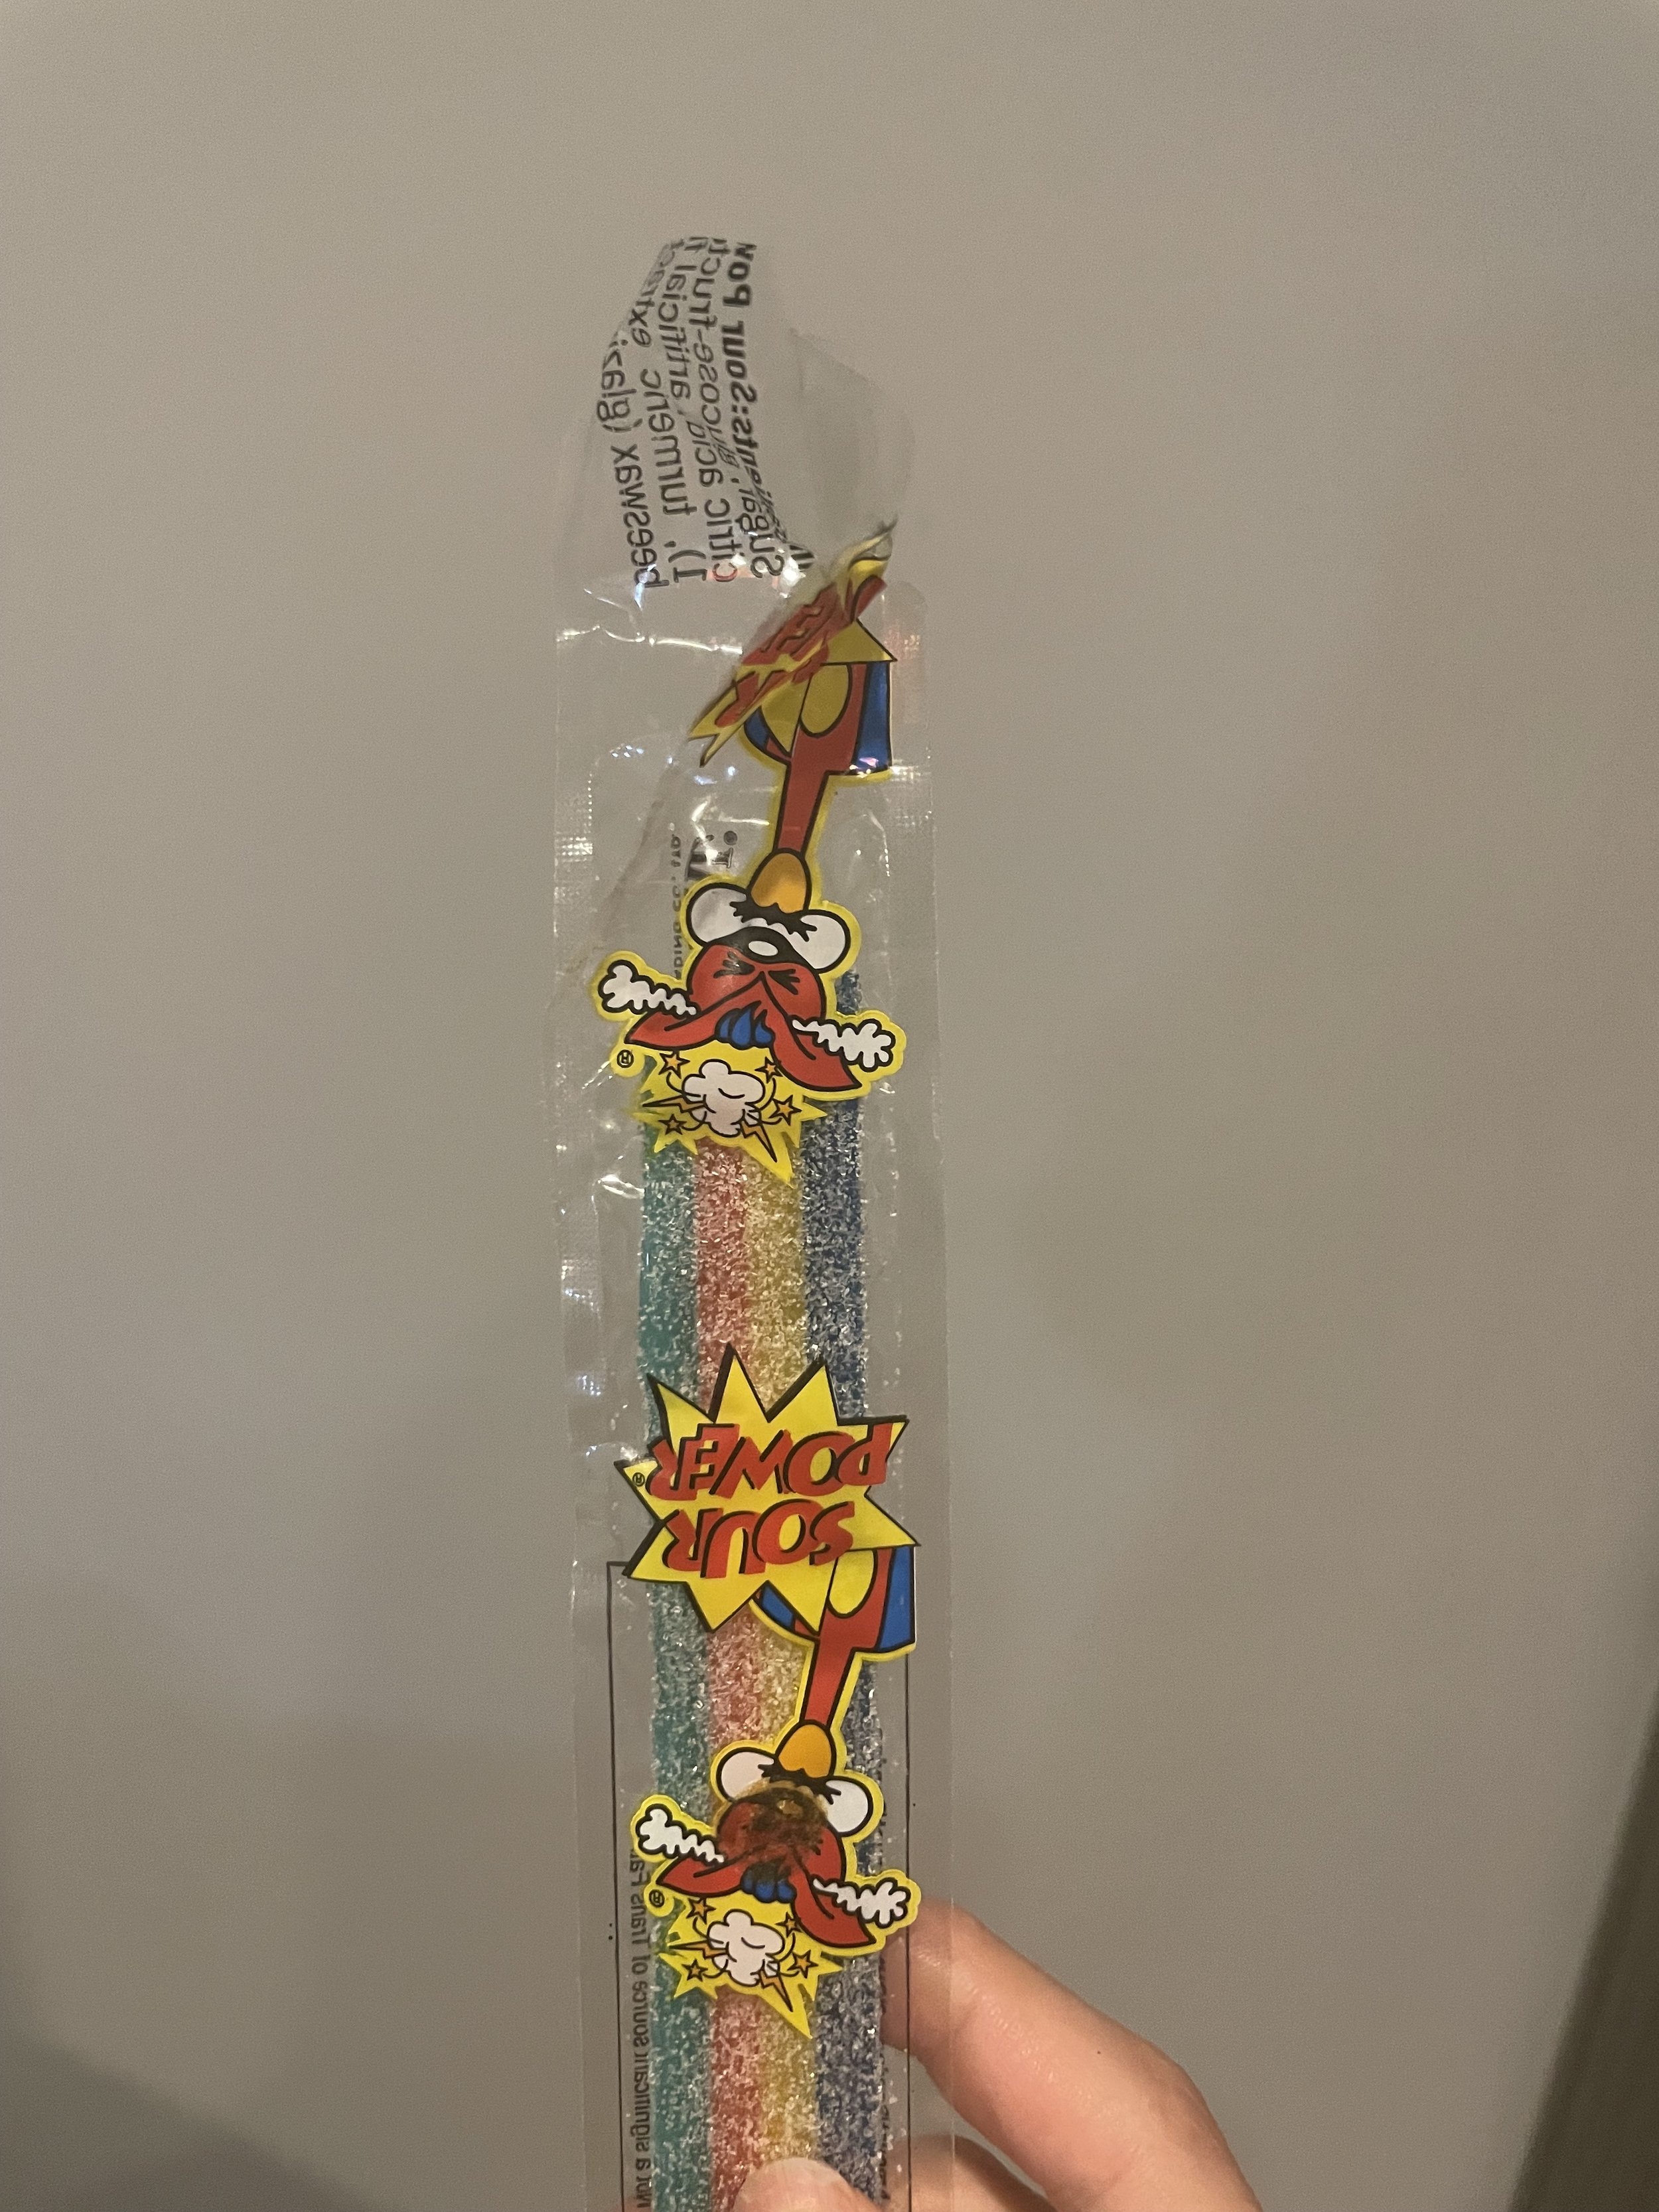
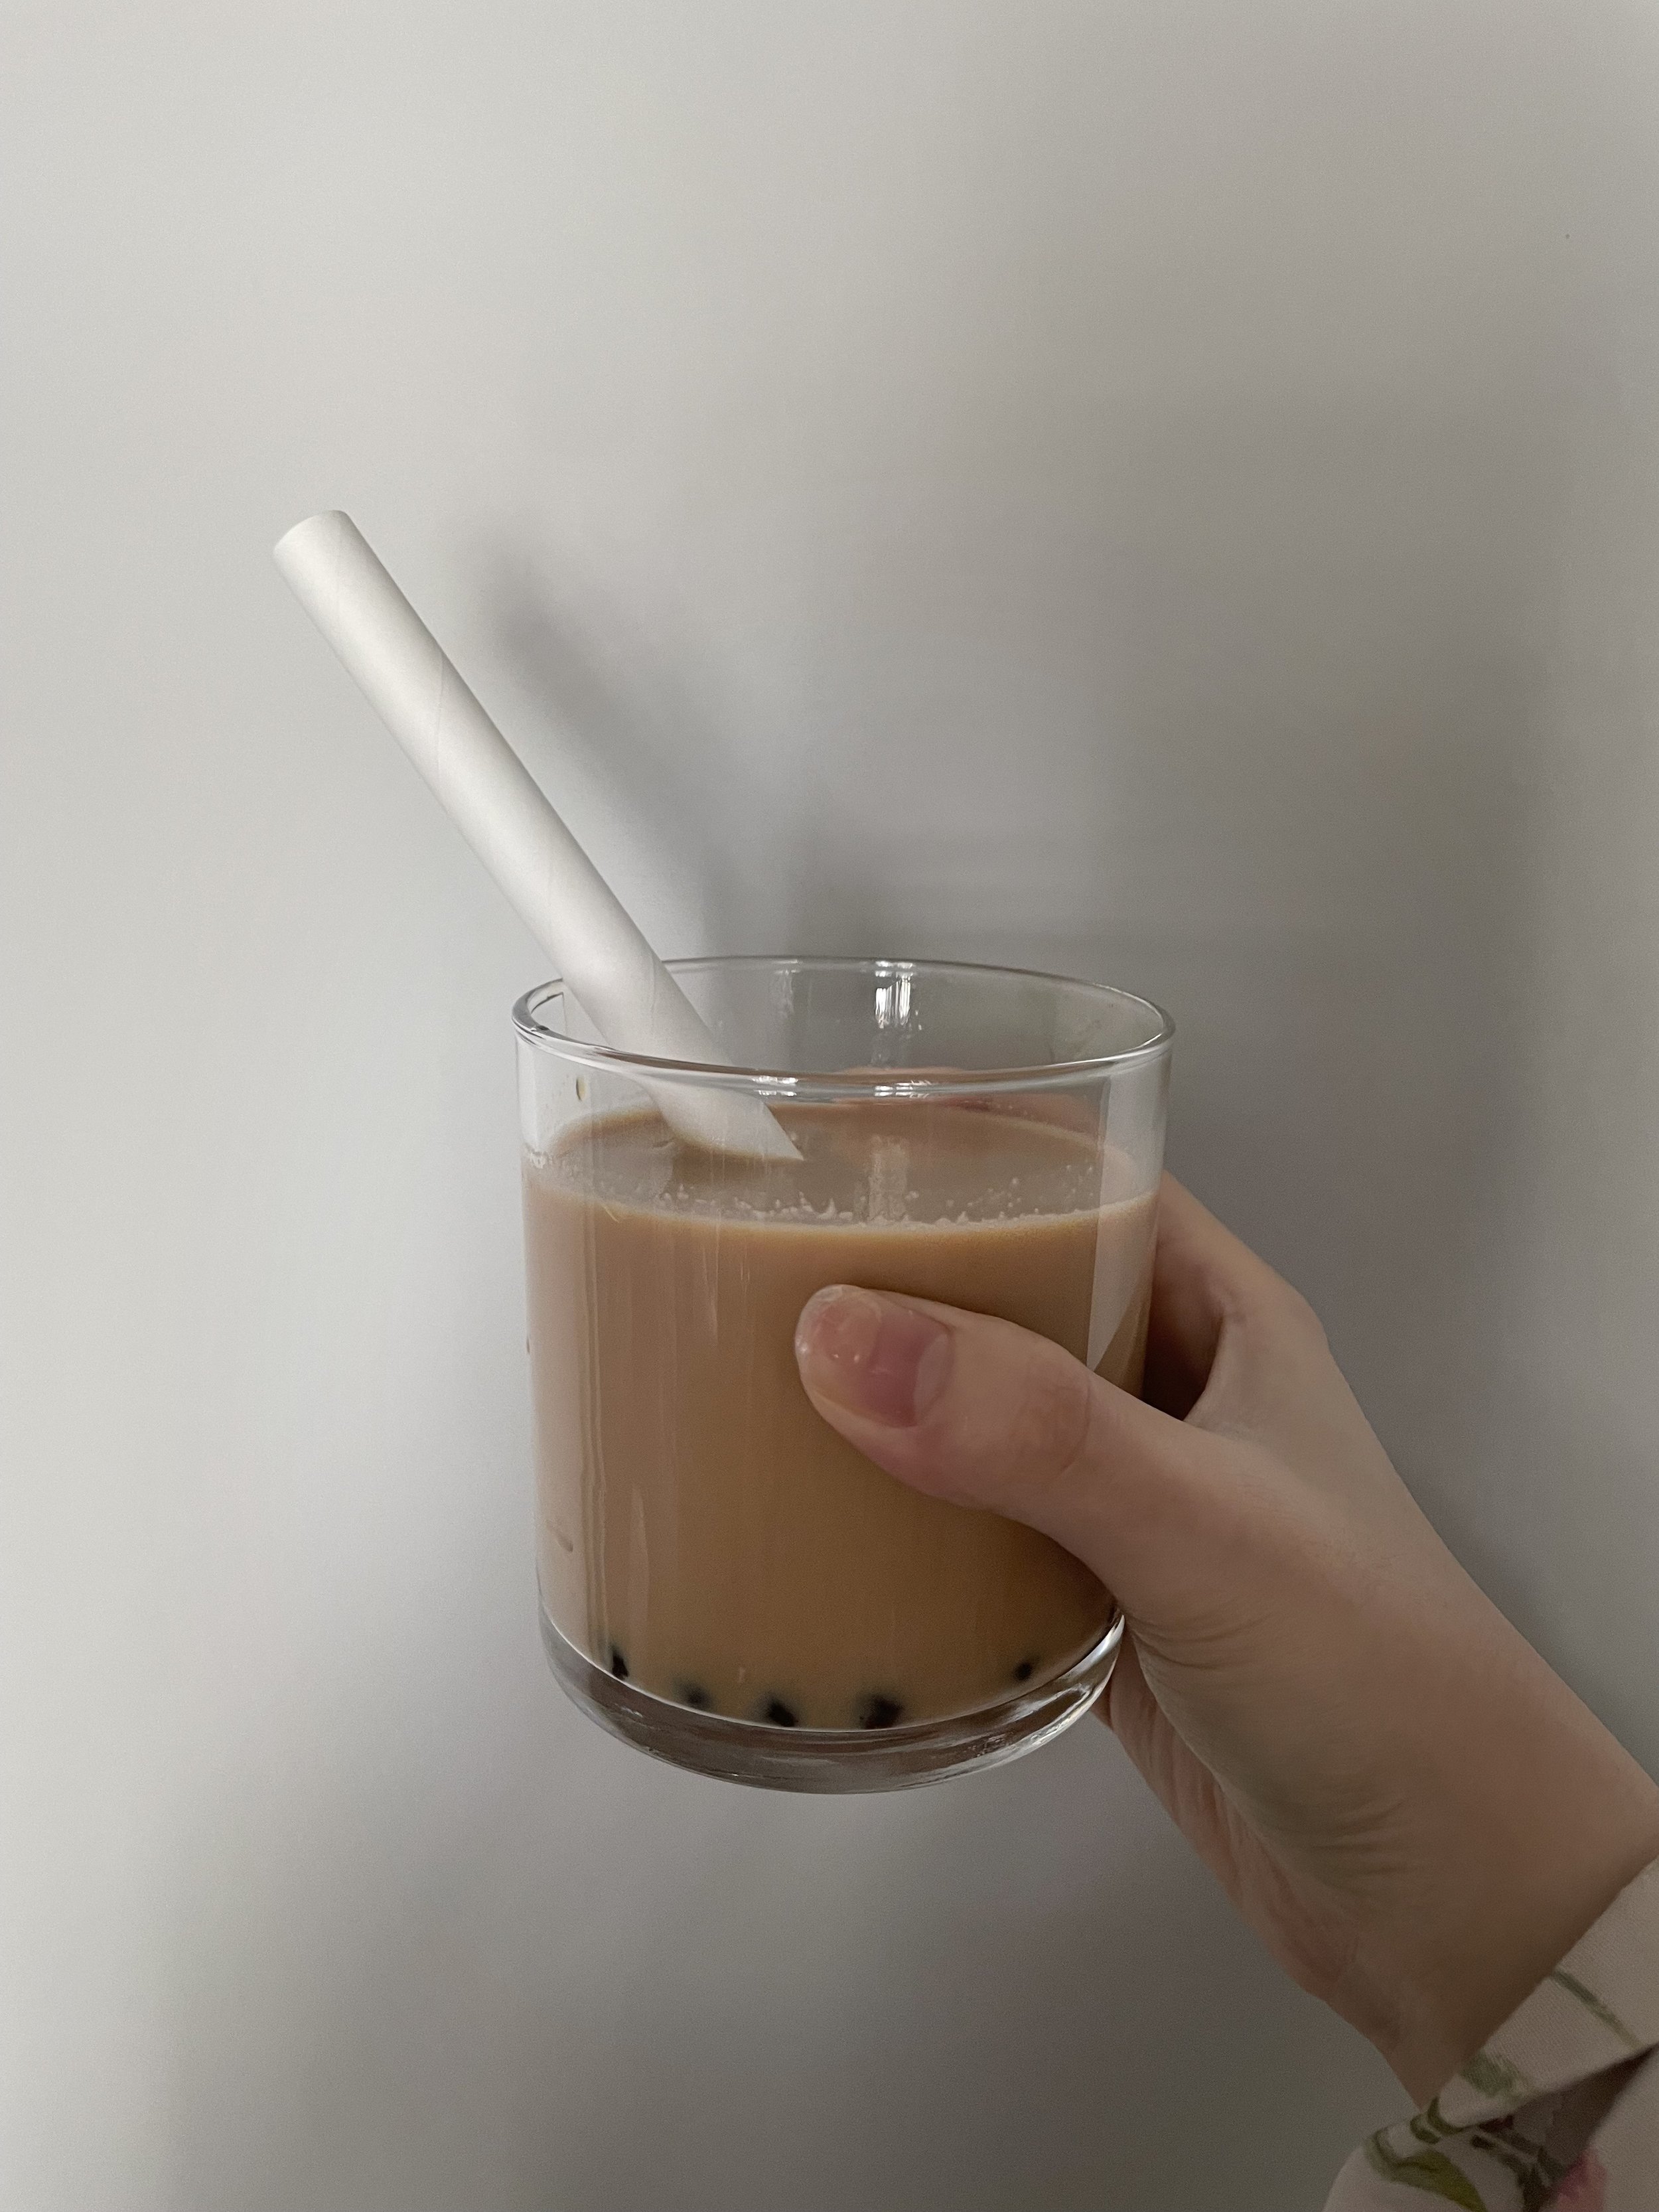
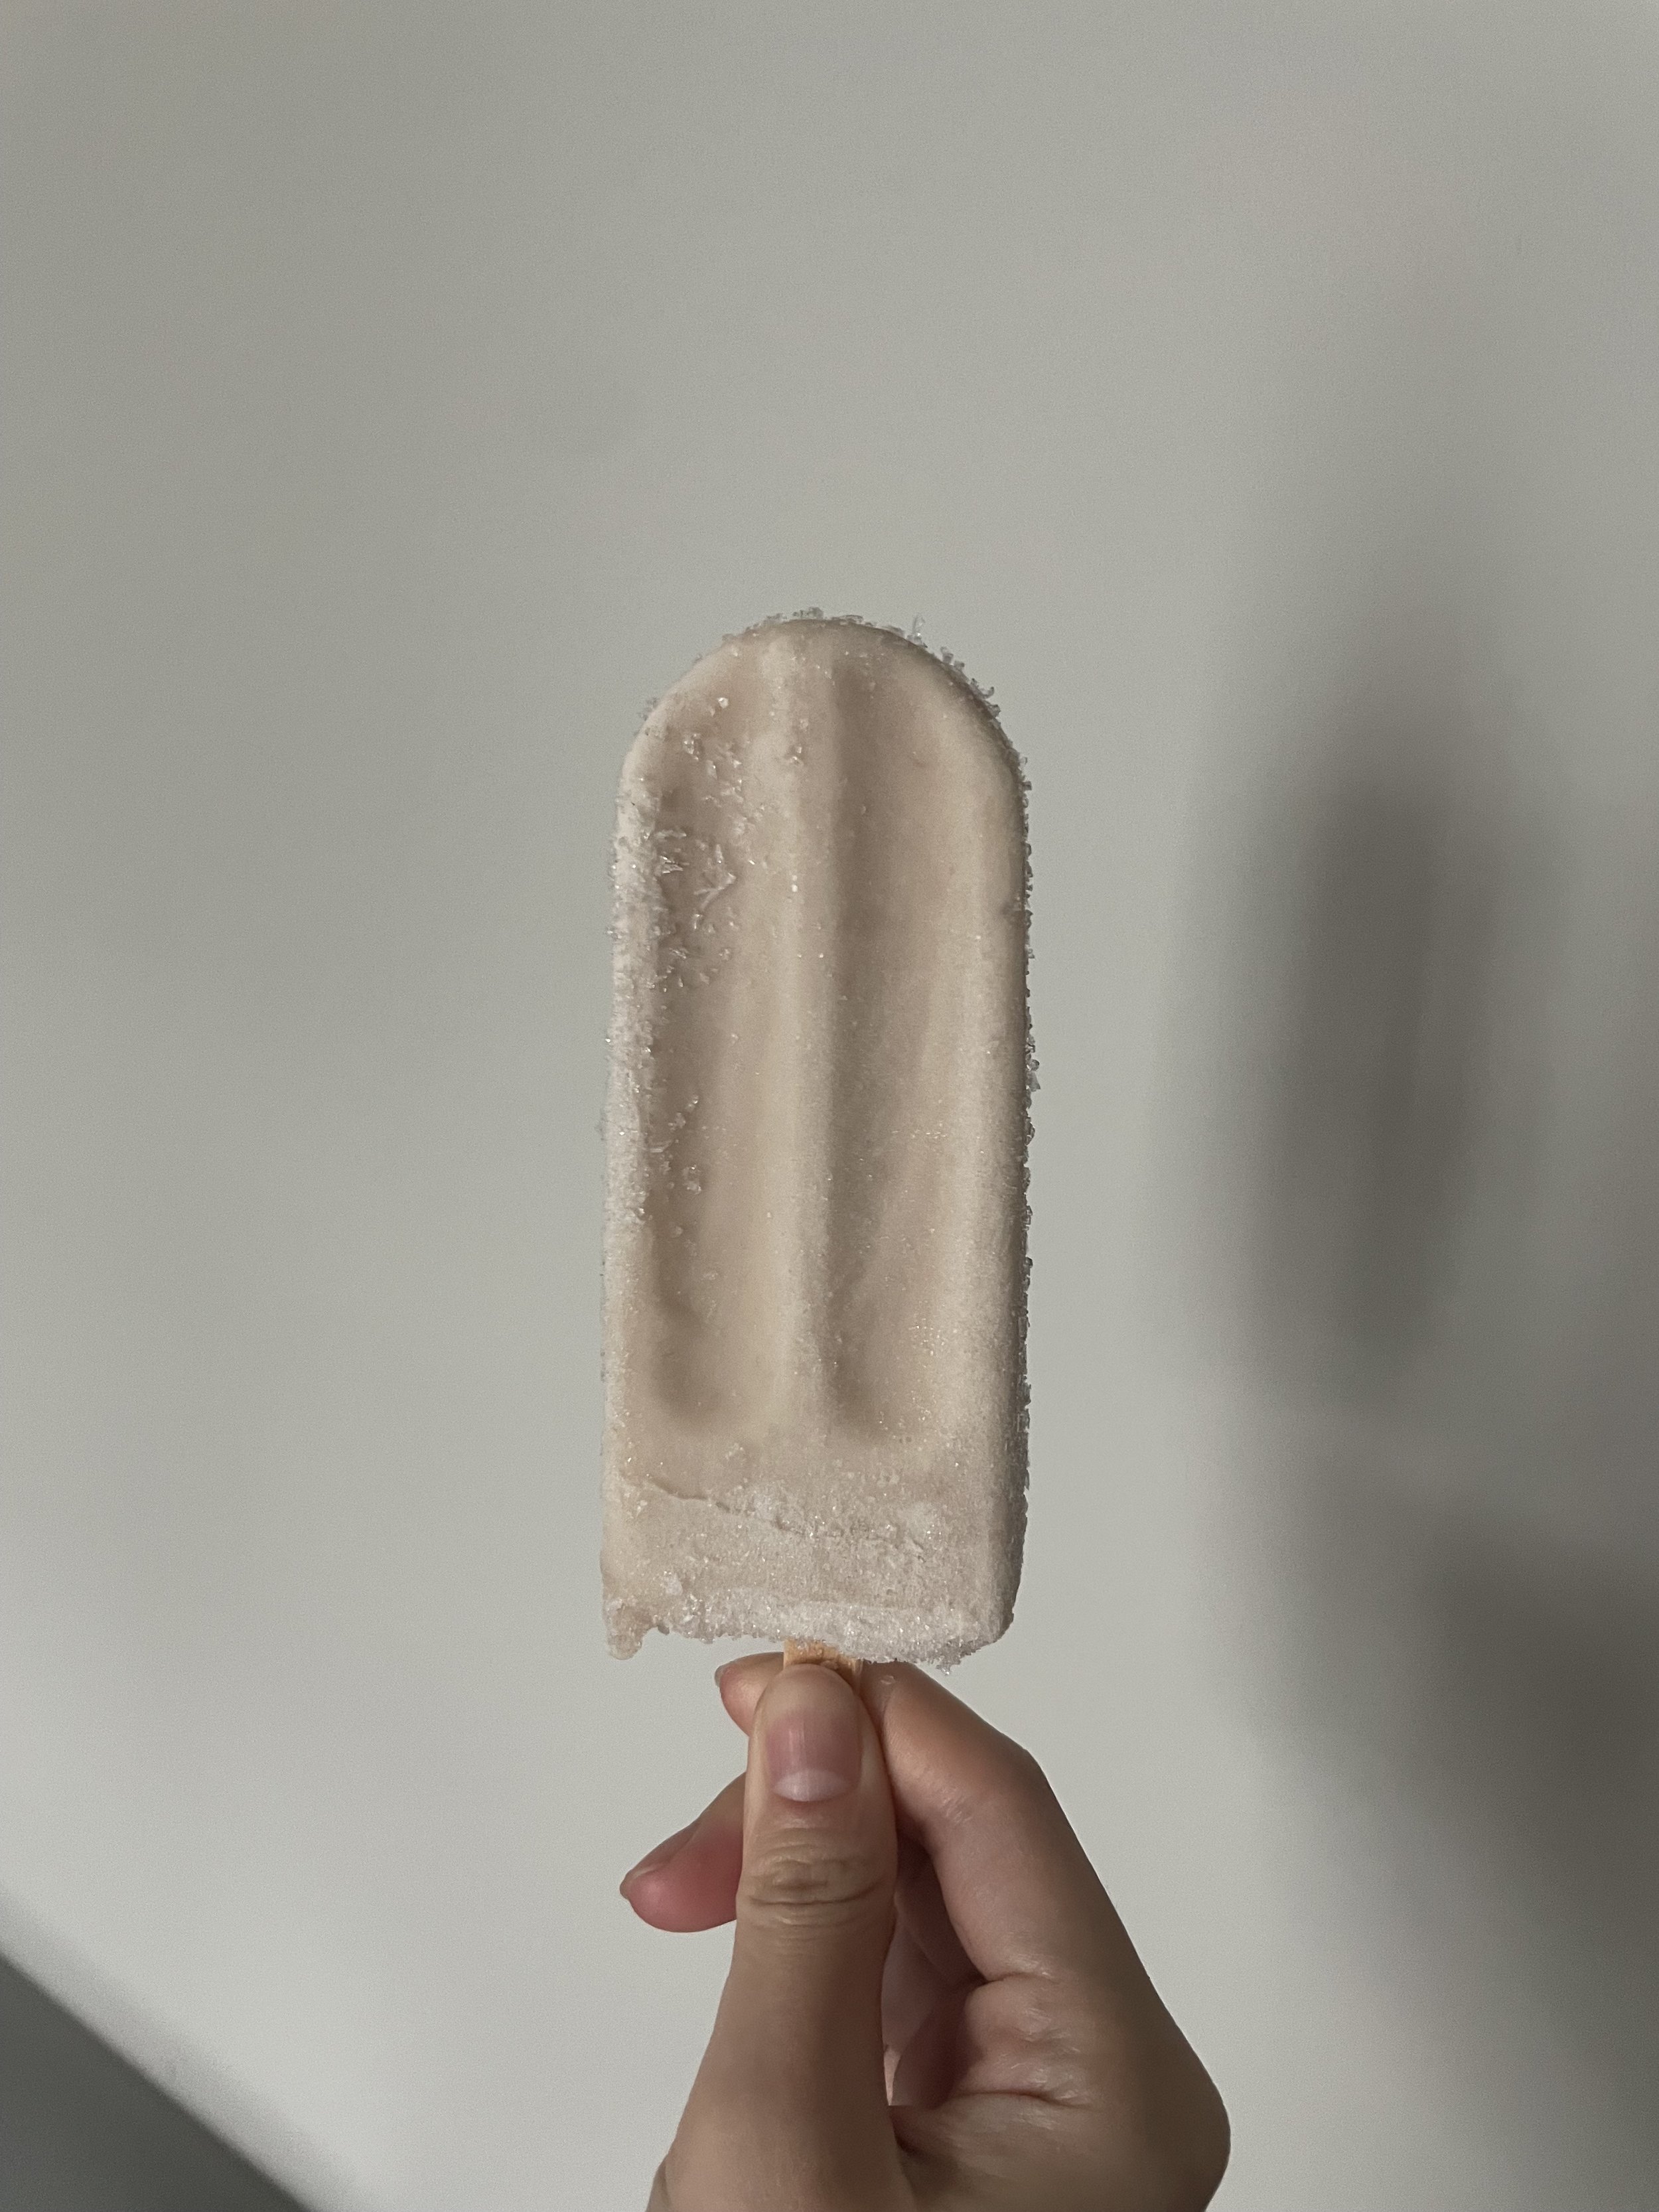
My life is blissfully “sugar-coated” as sweet treats serve as a major source of comfort in my daily activities.
"SUGARCOAT" represents a comprehensive data visualization that breaks down my daily consumption of sugary foods, revealing the factors that influence my sugar cravings.
A data visualization website reveals my “sugar-craving” life.
SUGARCOAT
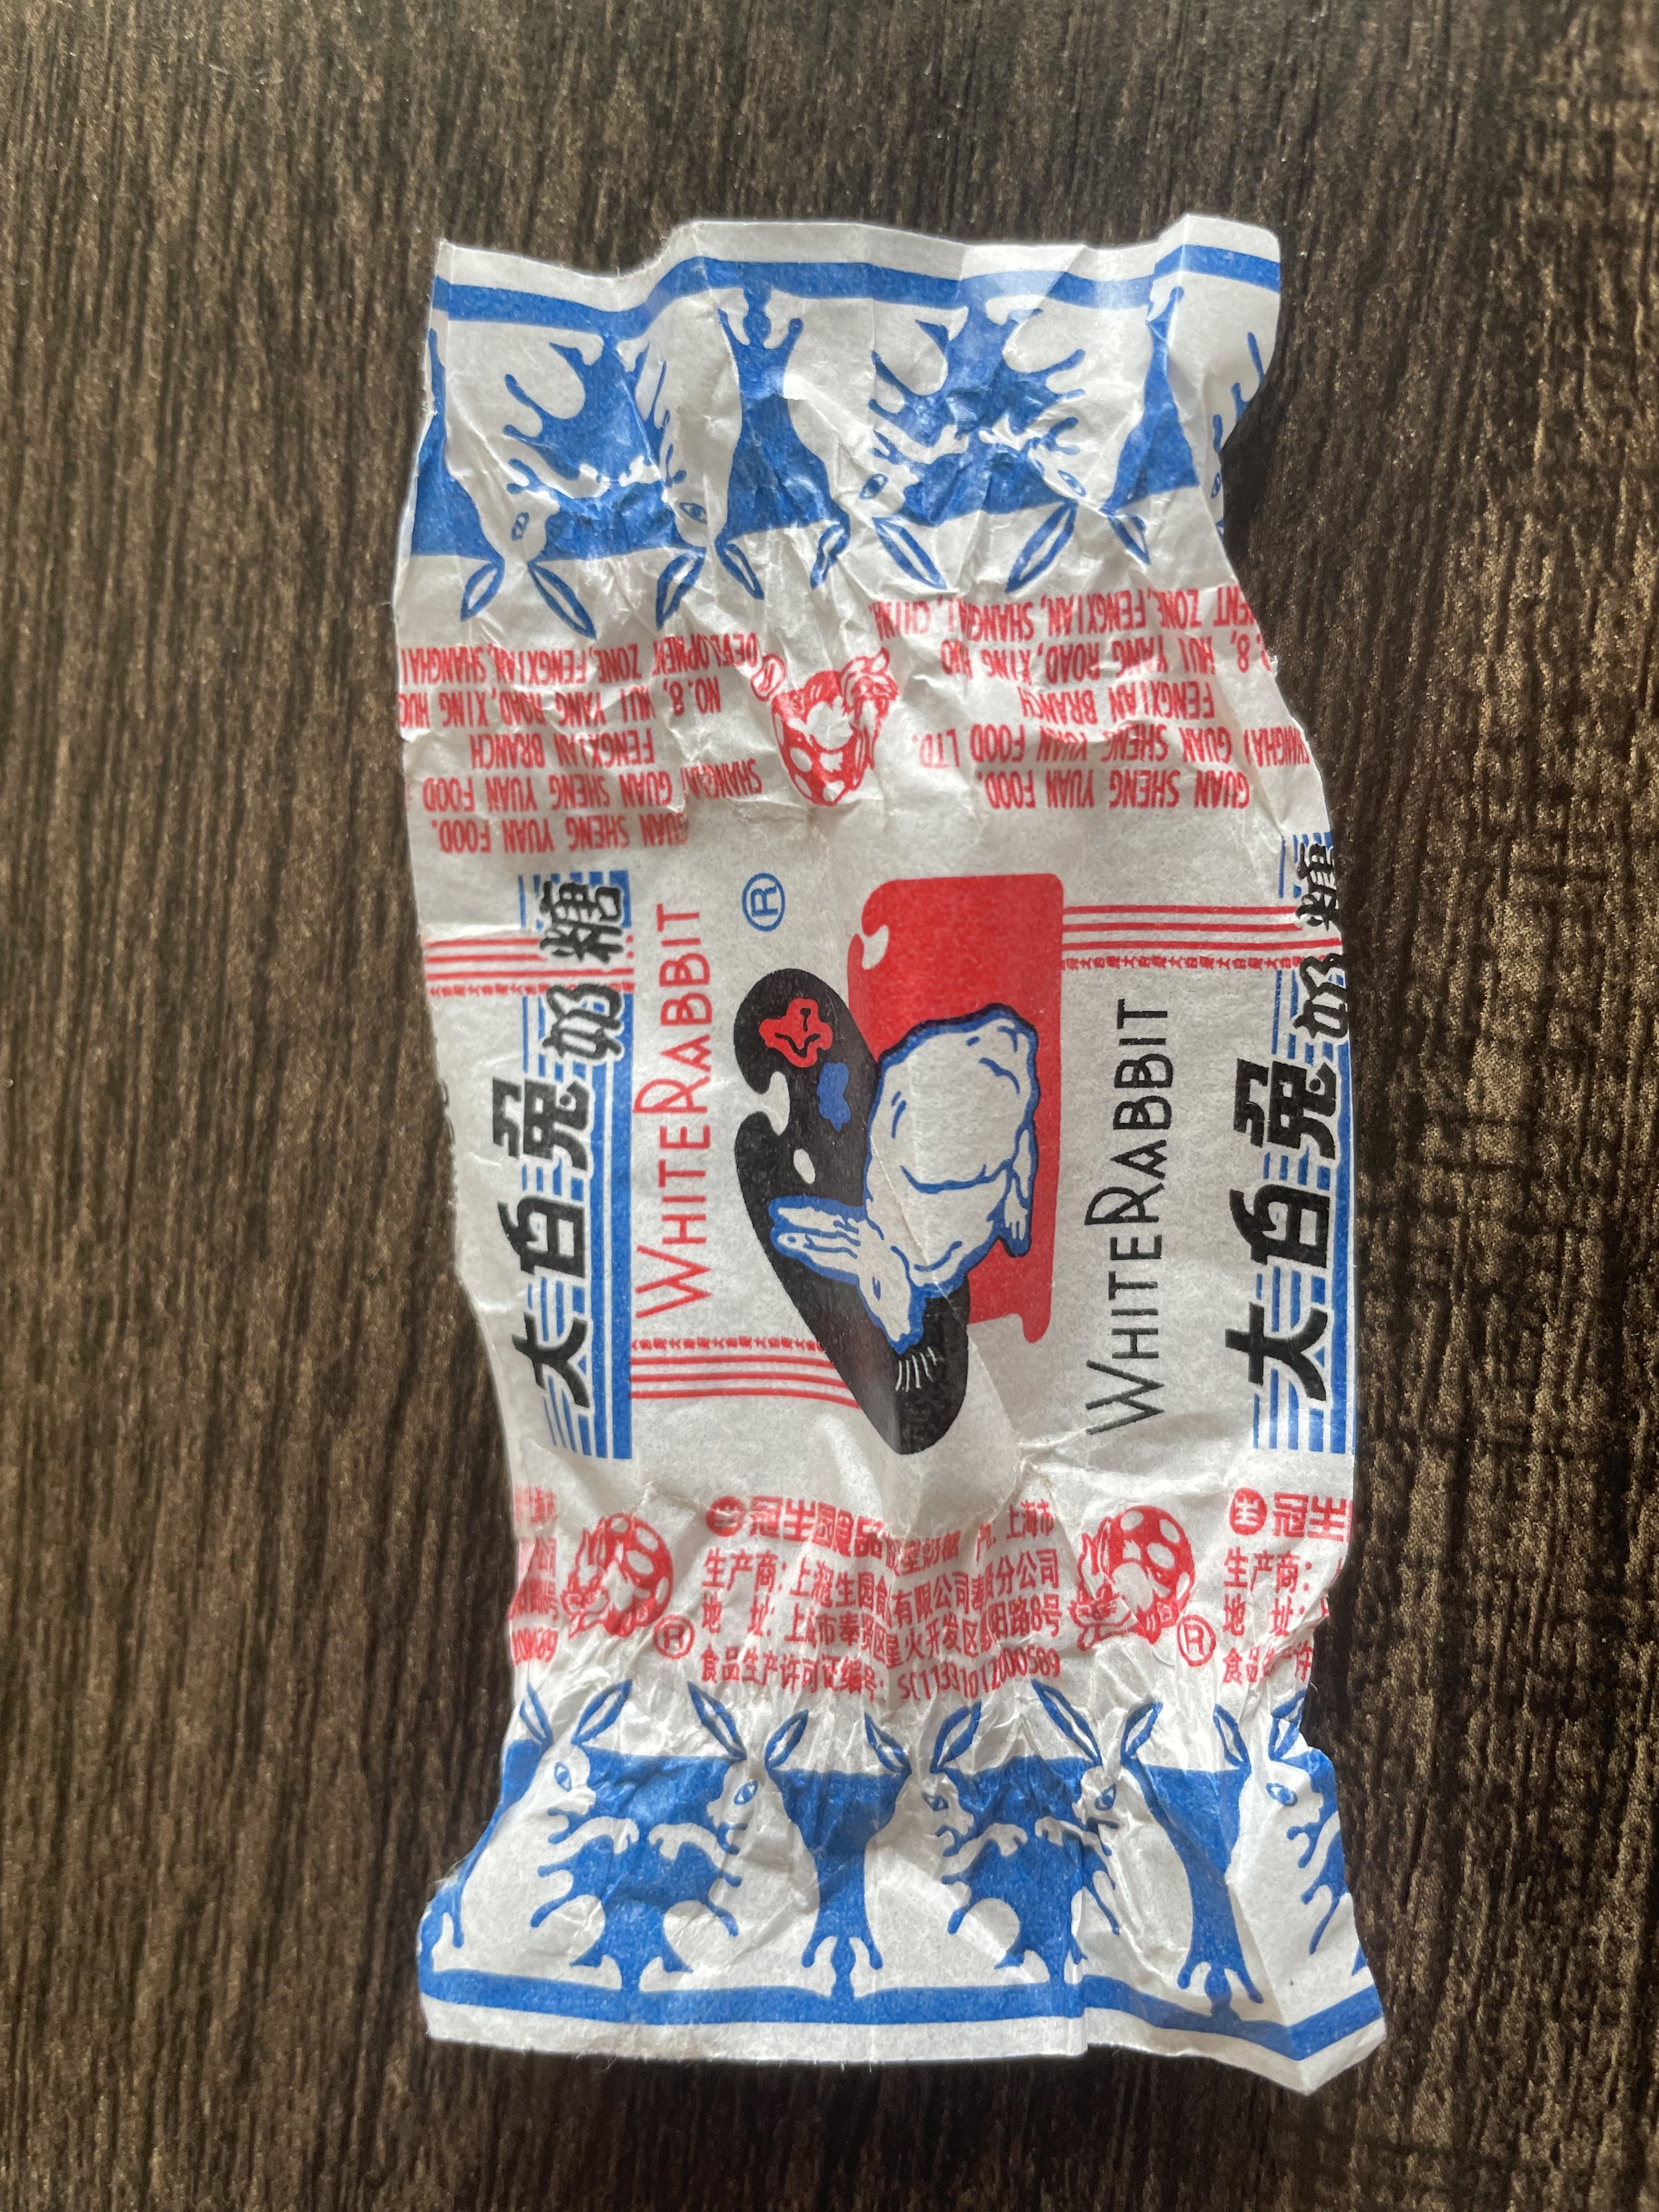
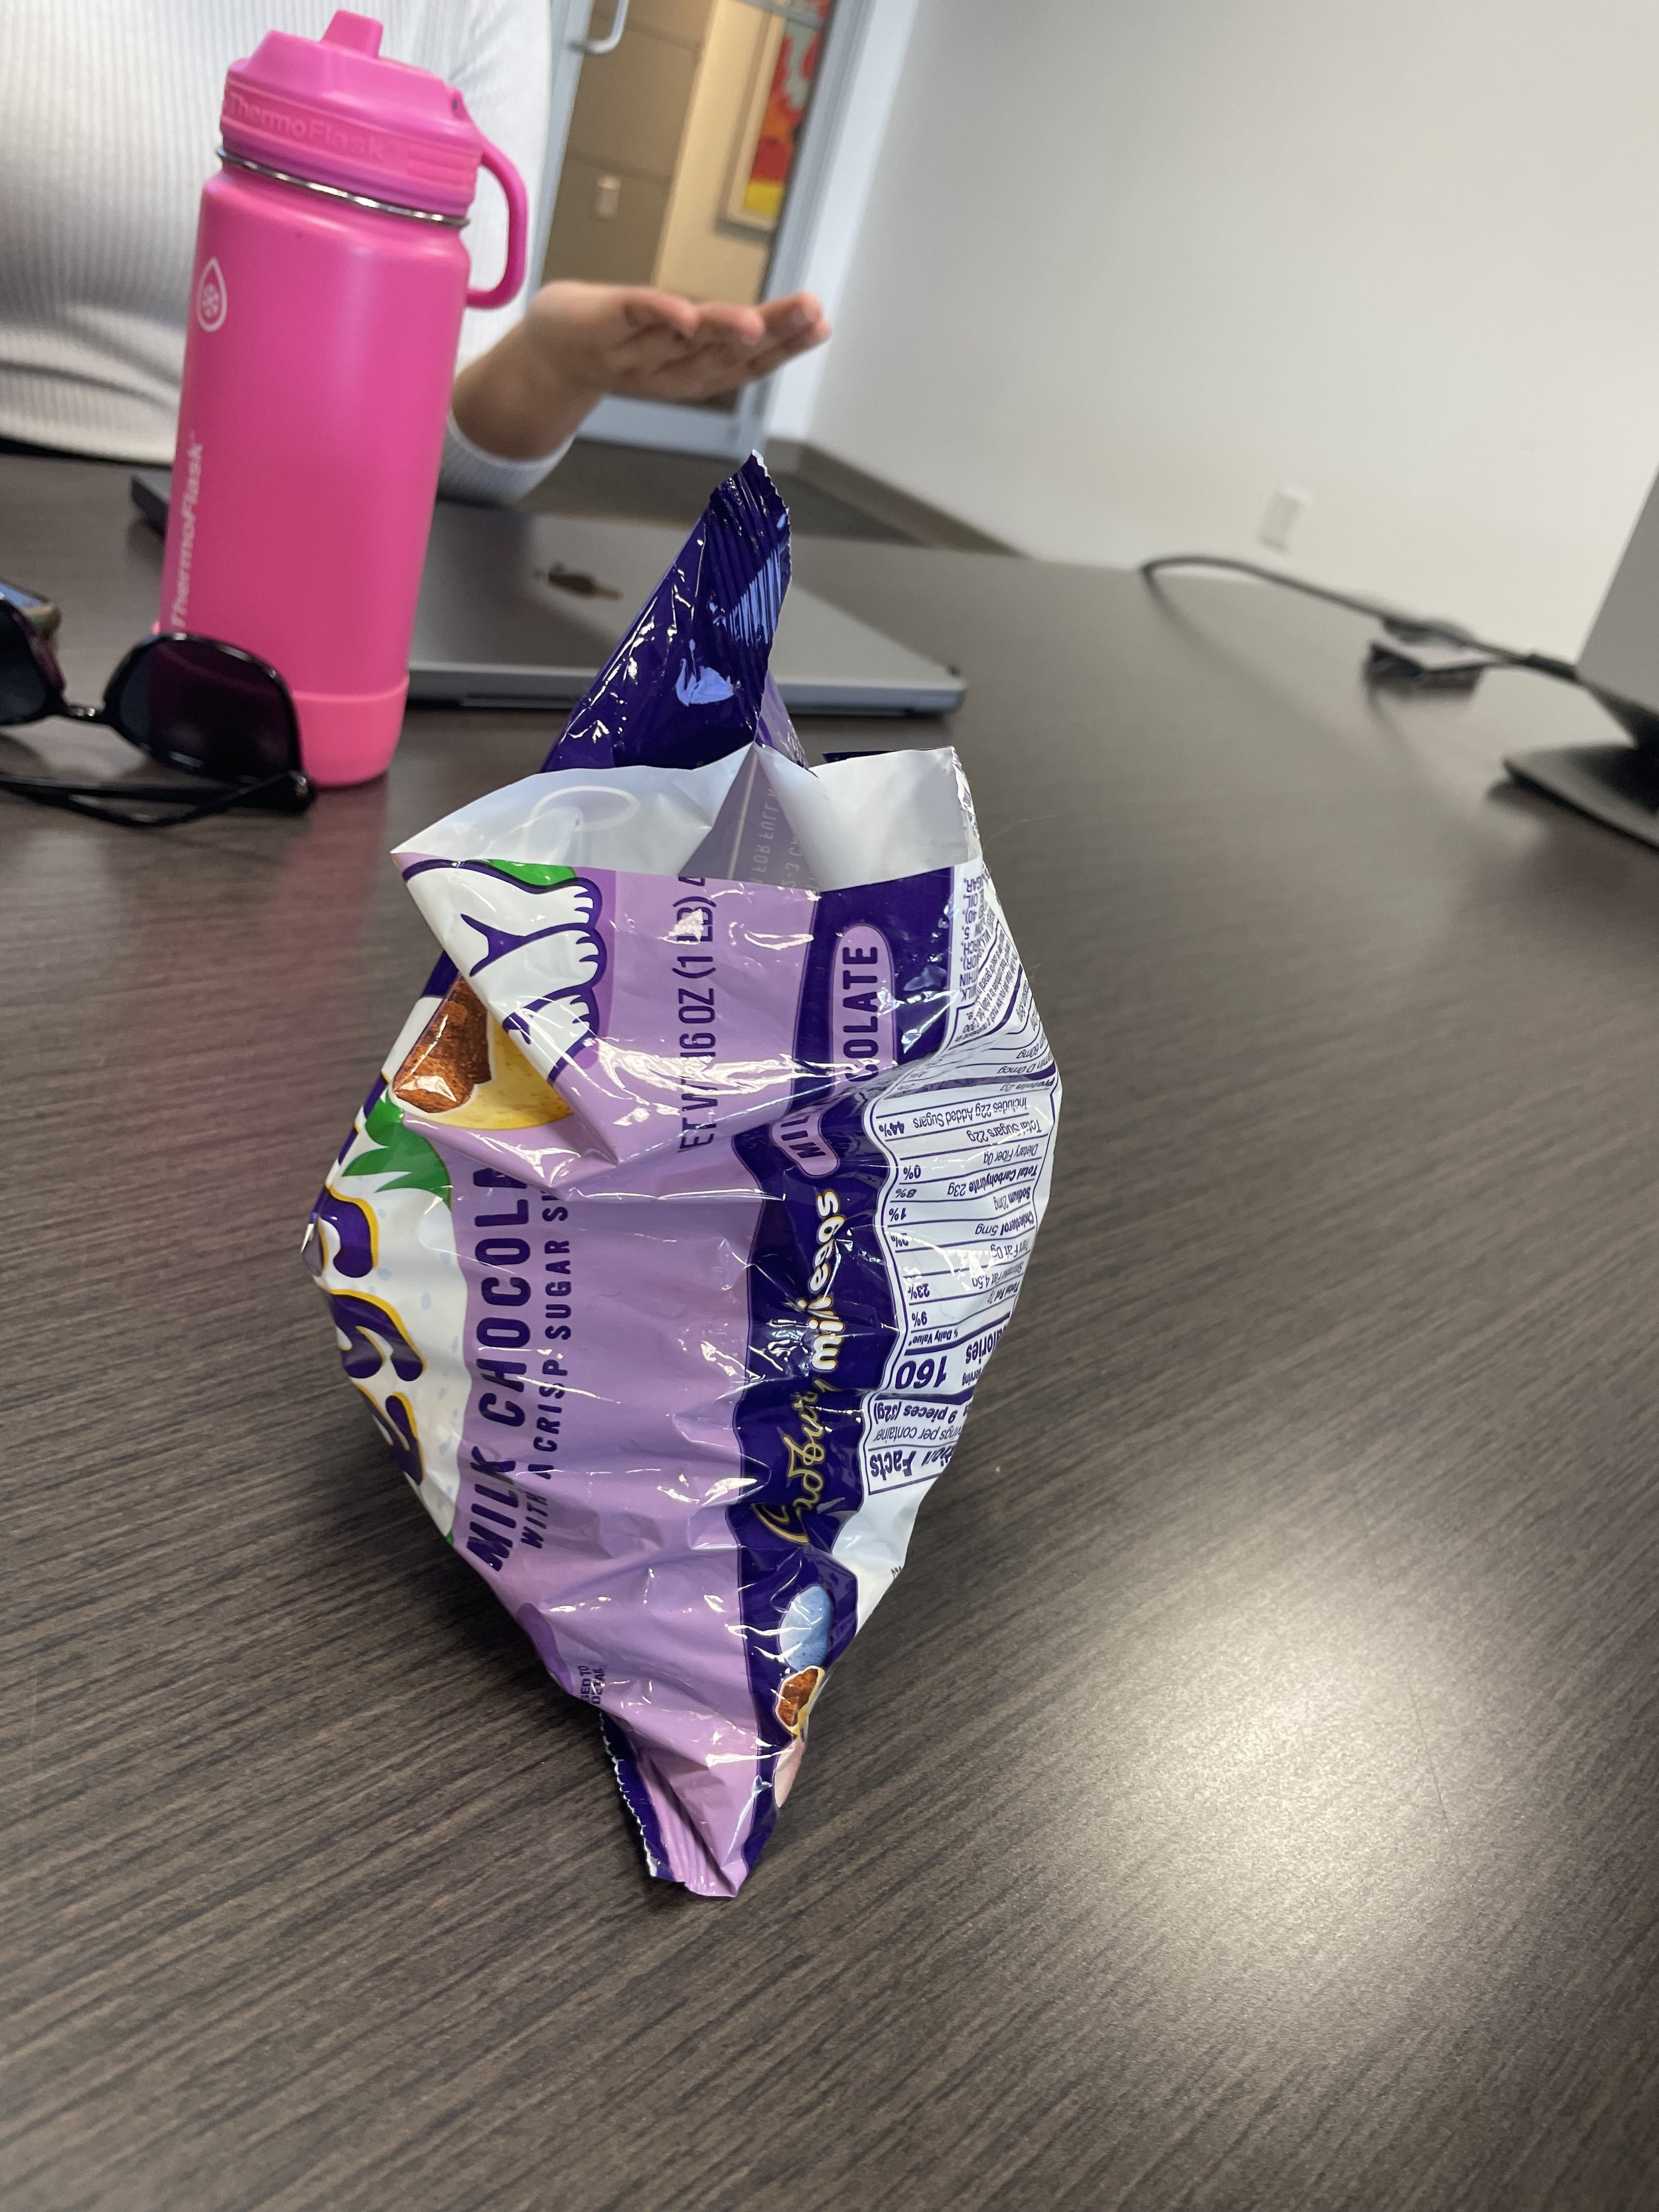
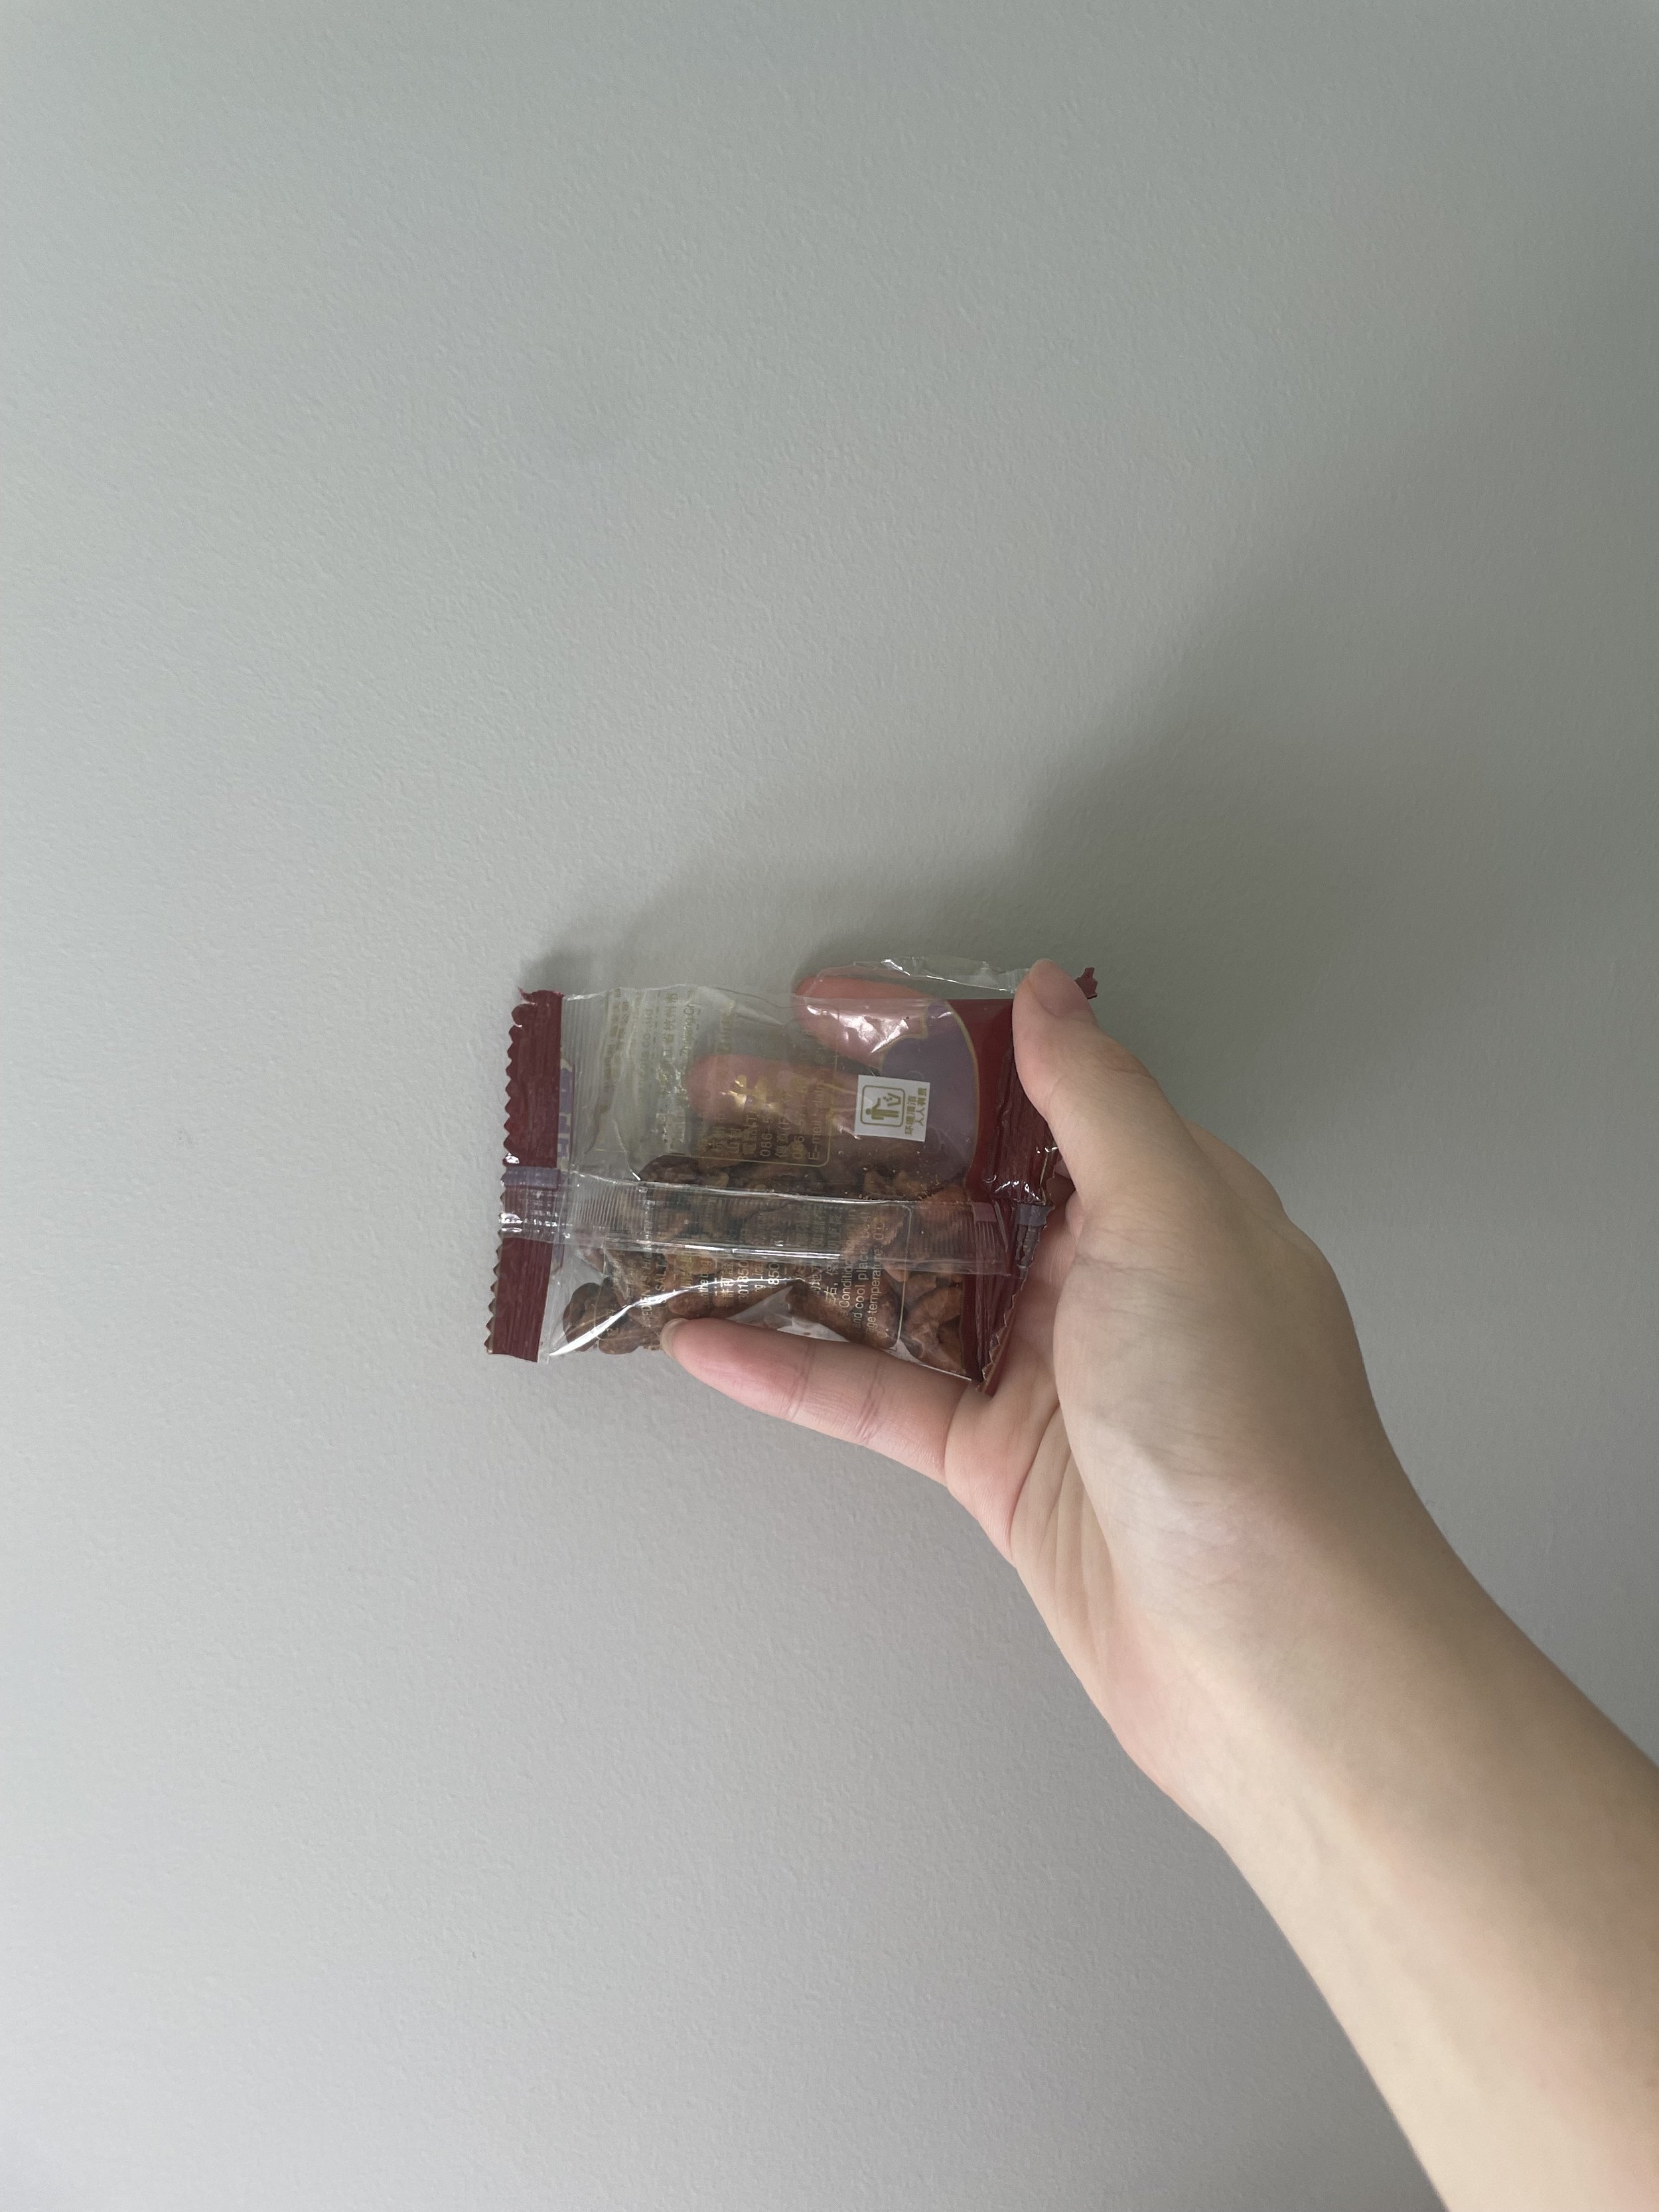
Sugary food plays an important role in my life…


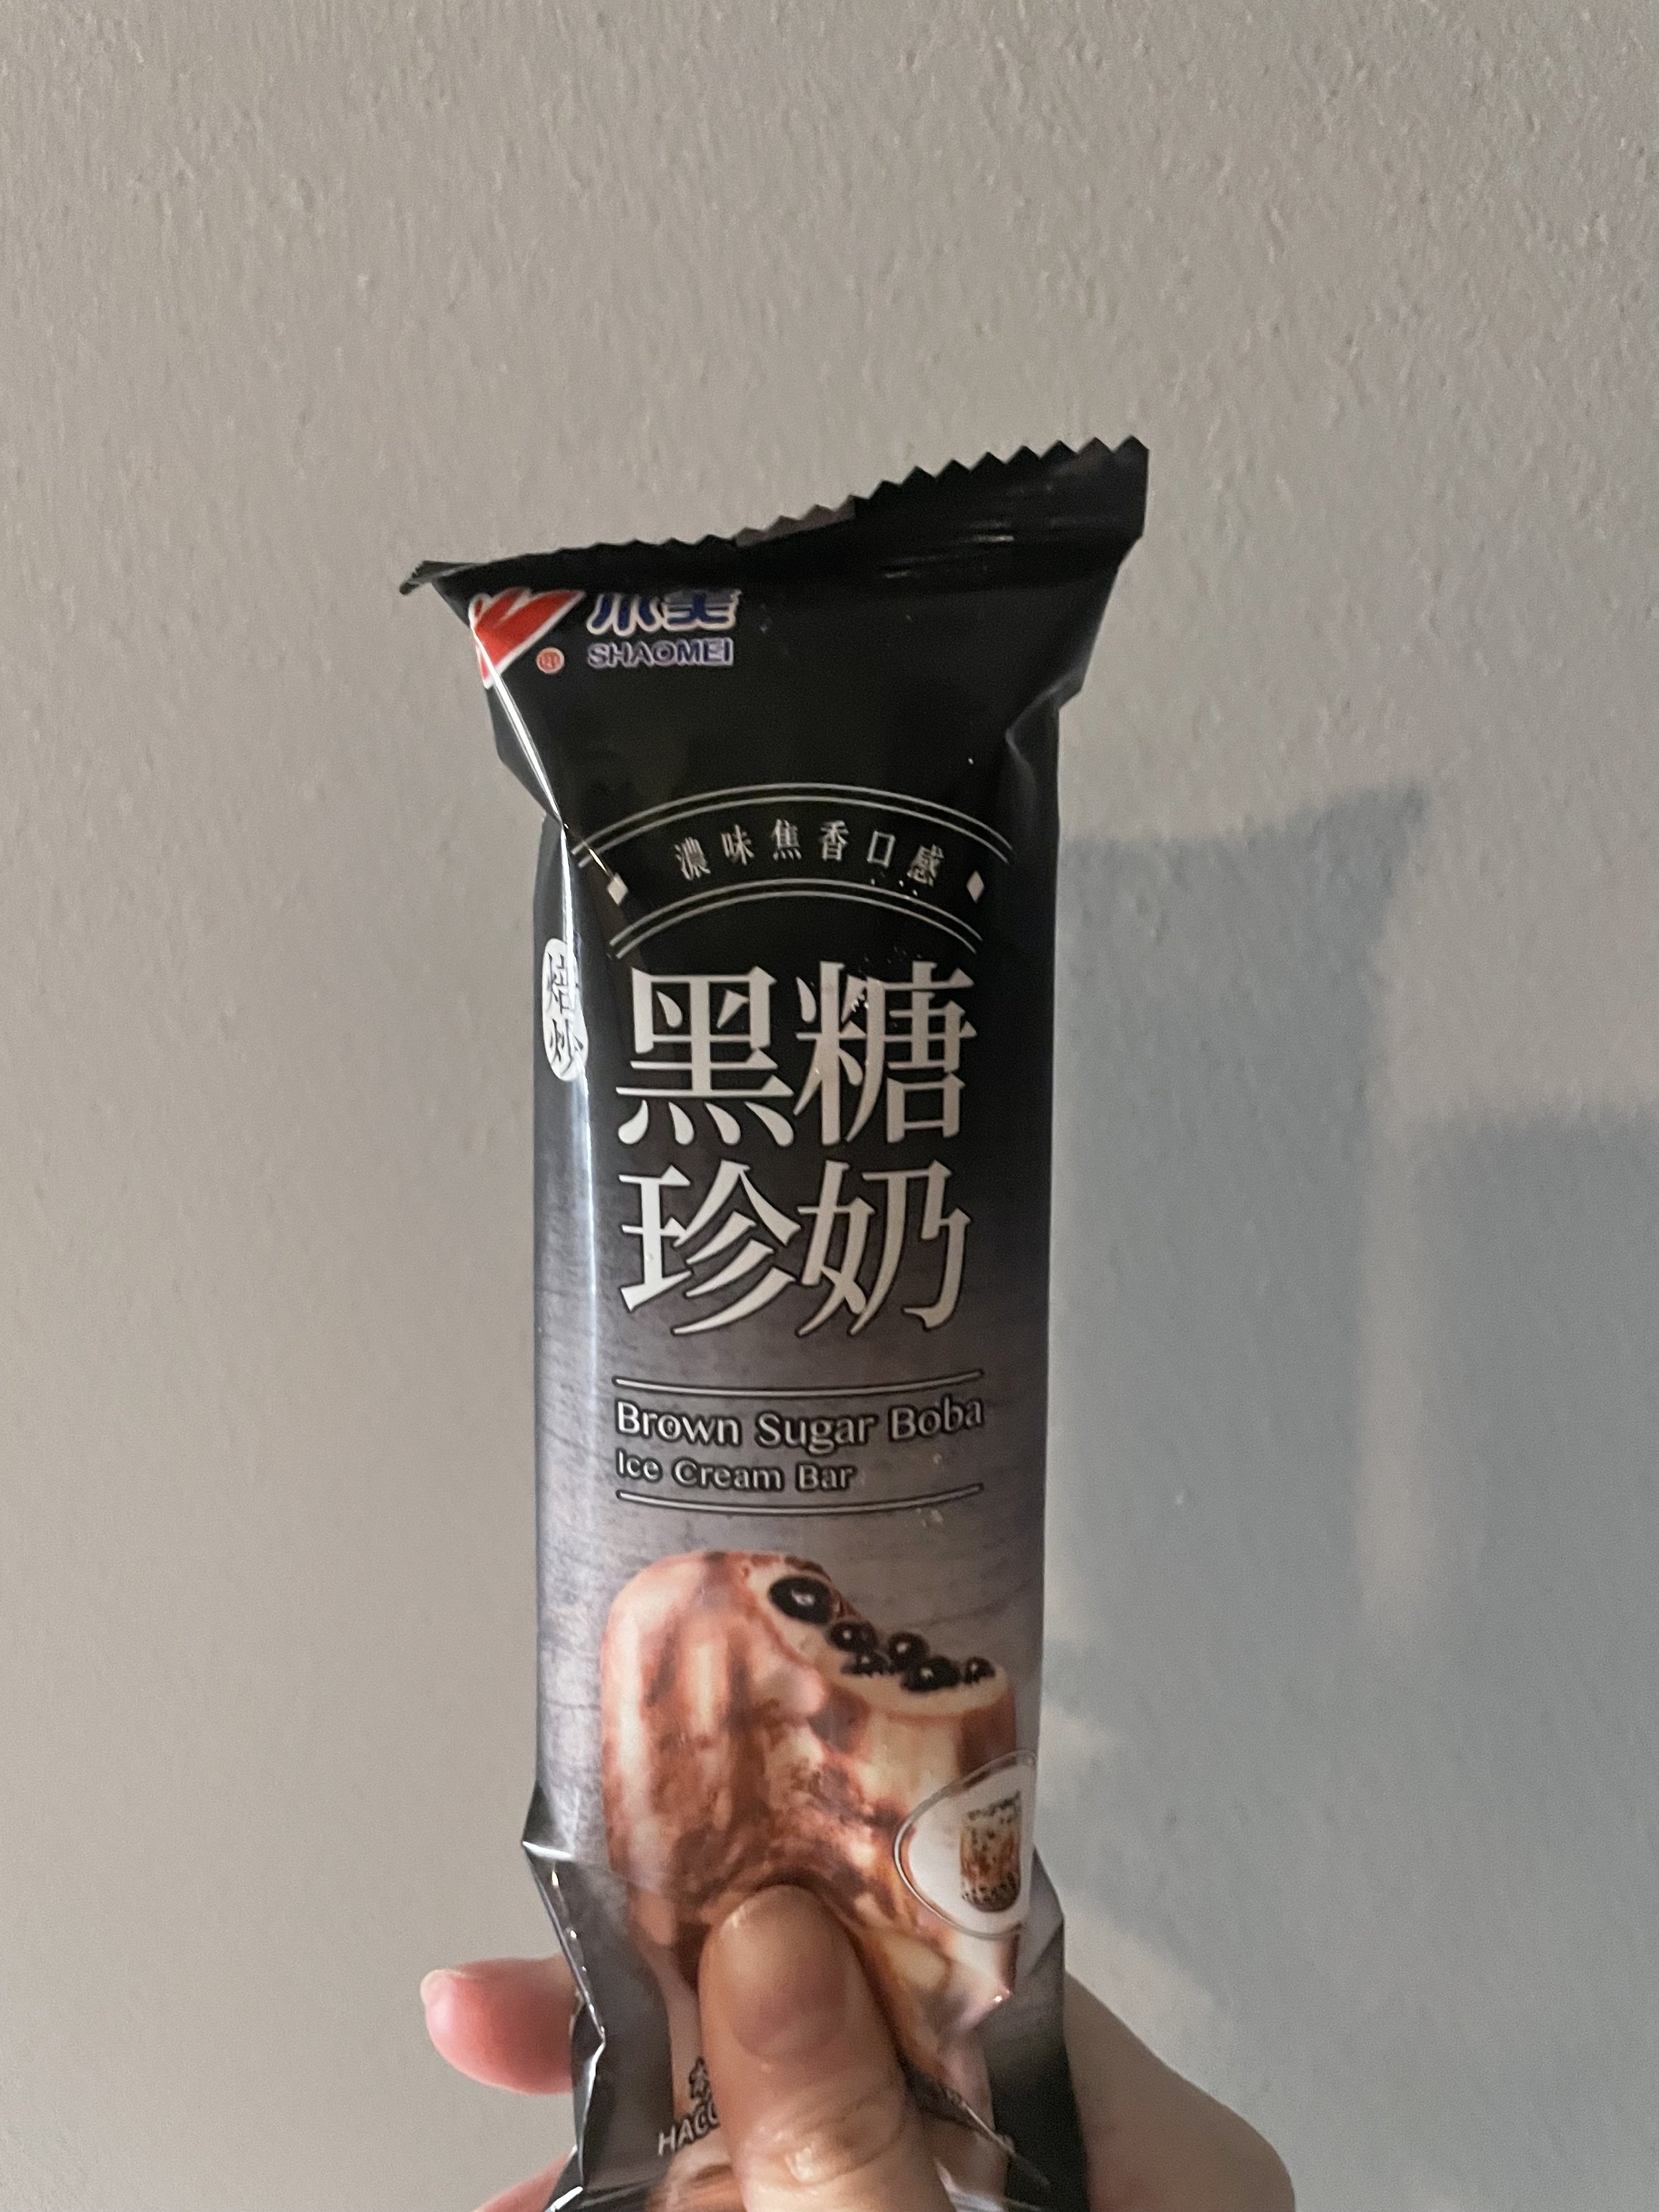

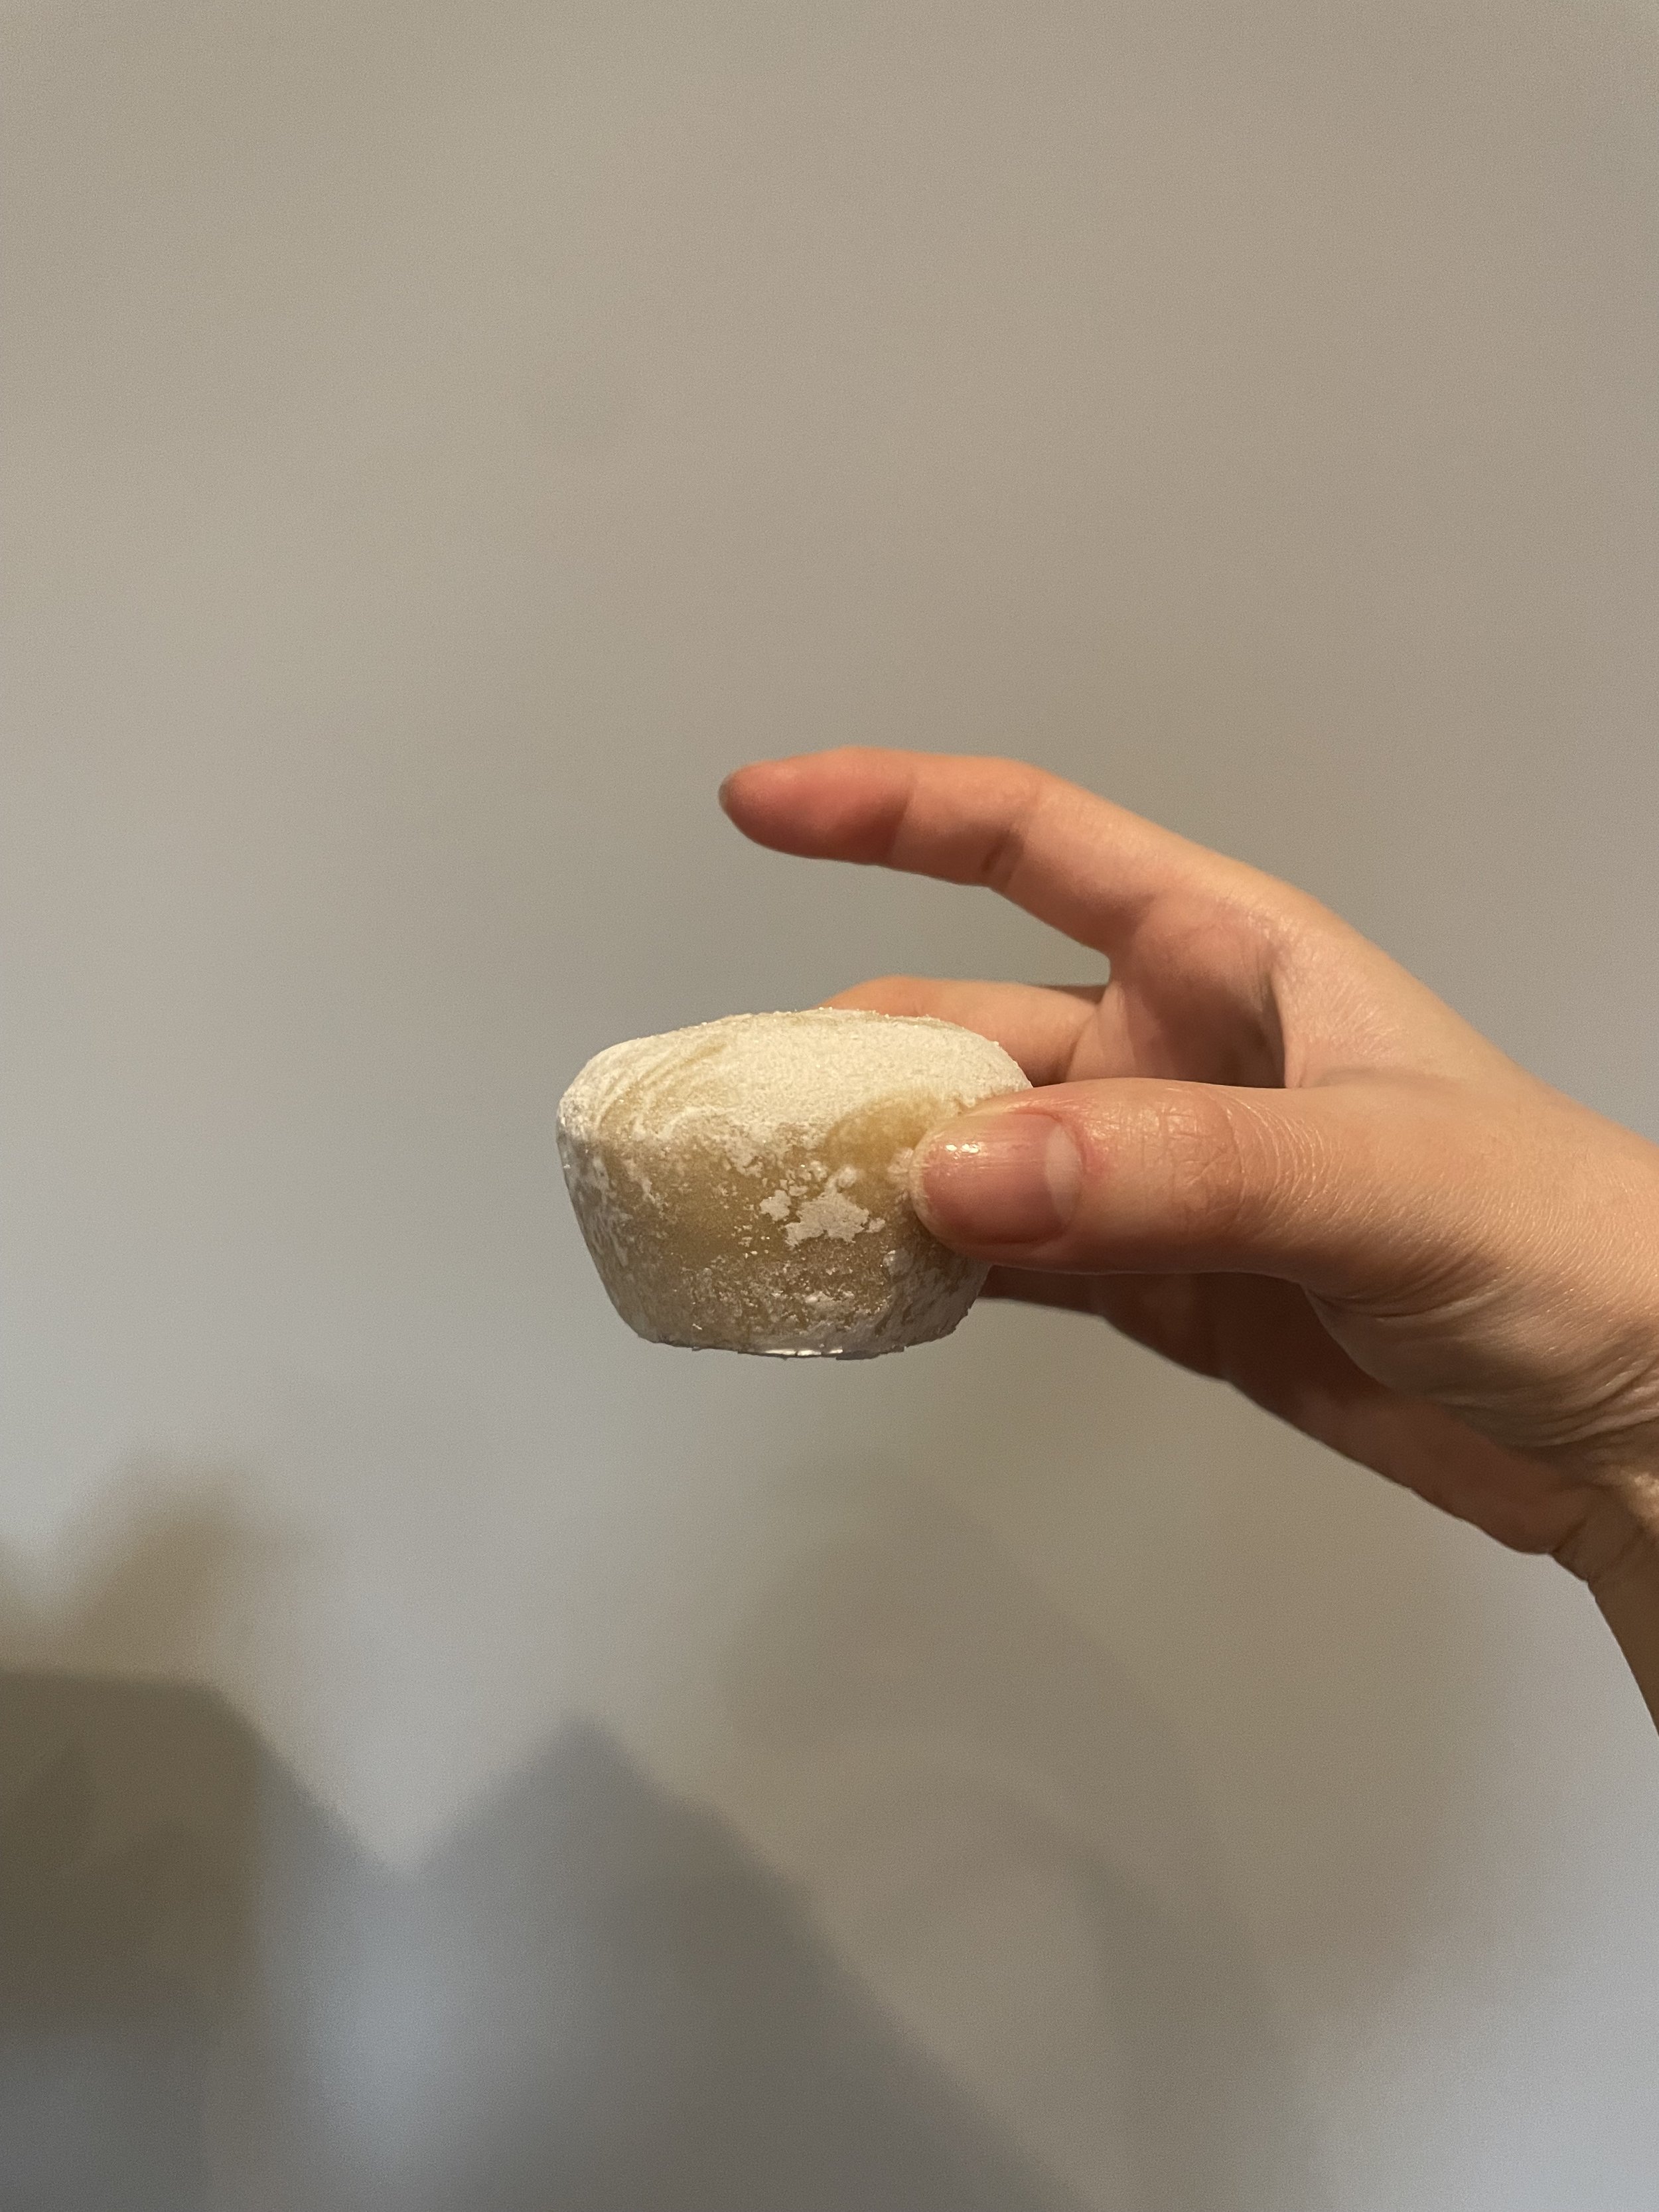
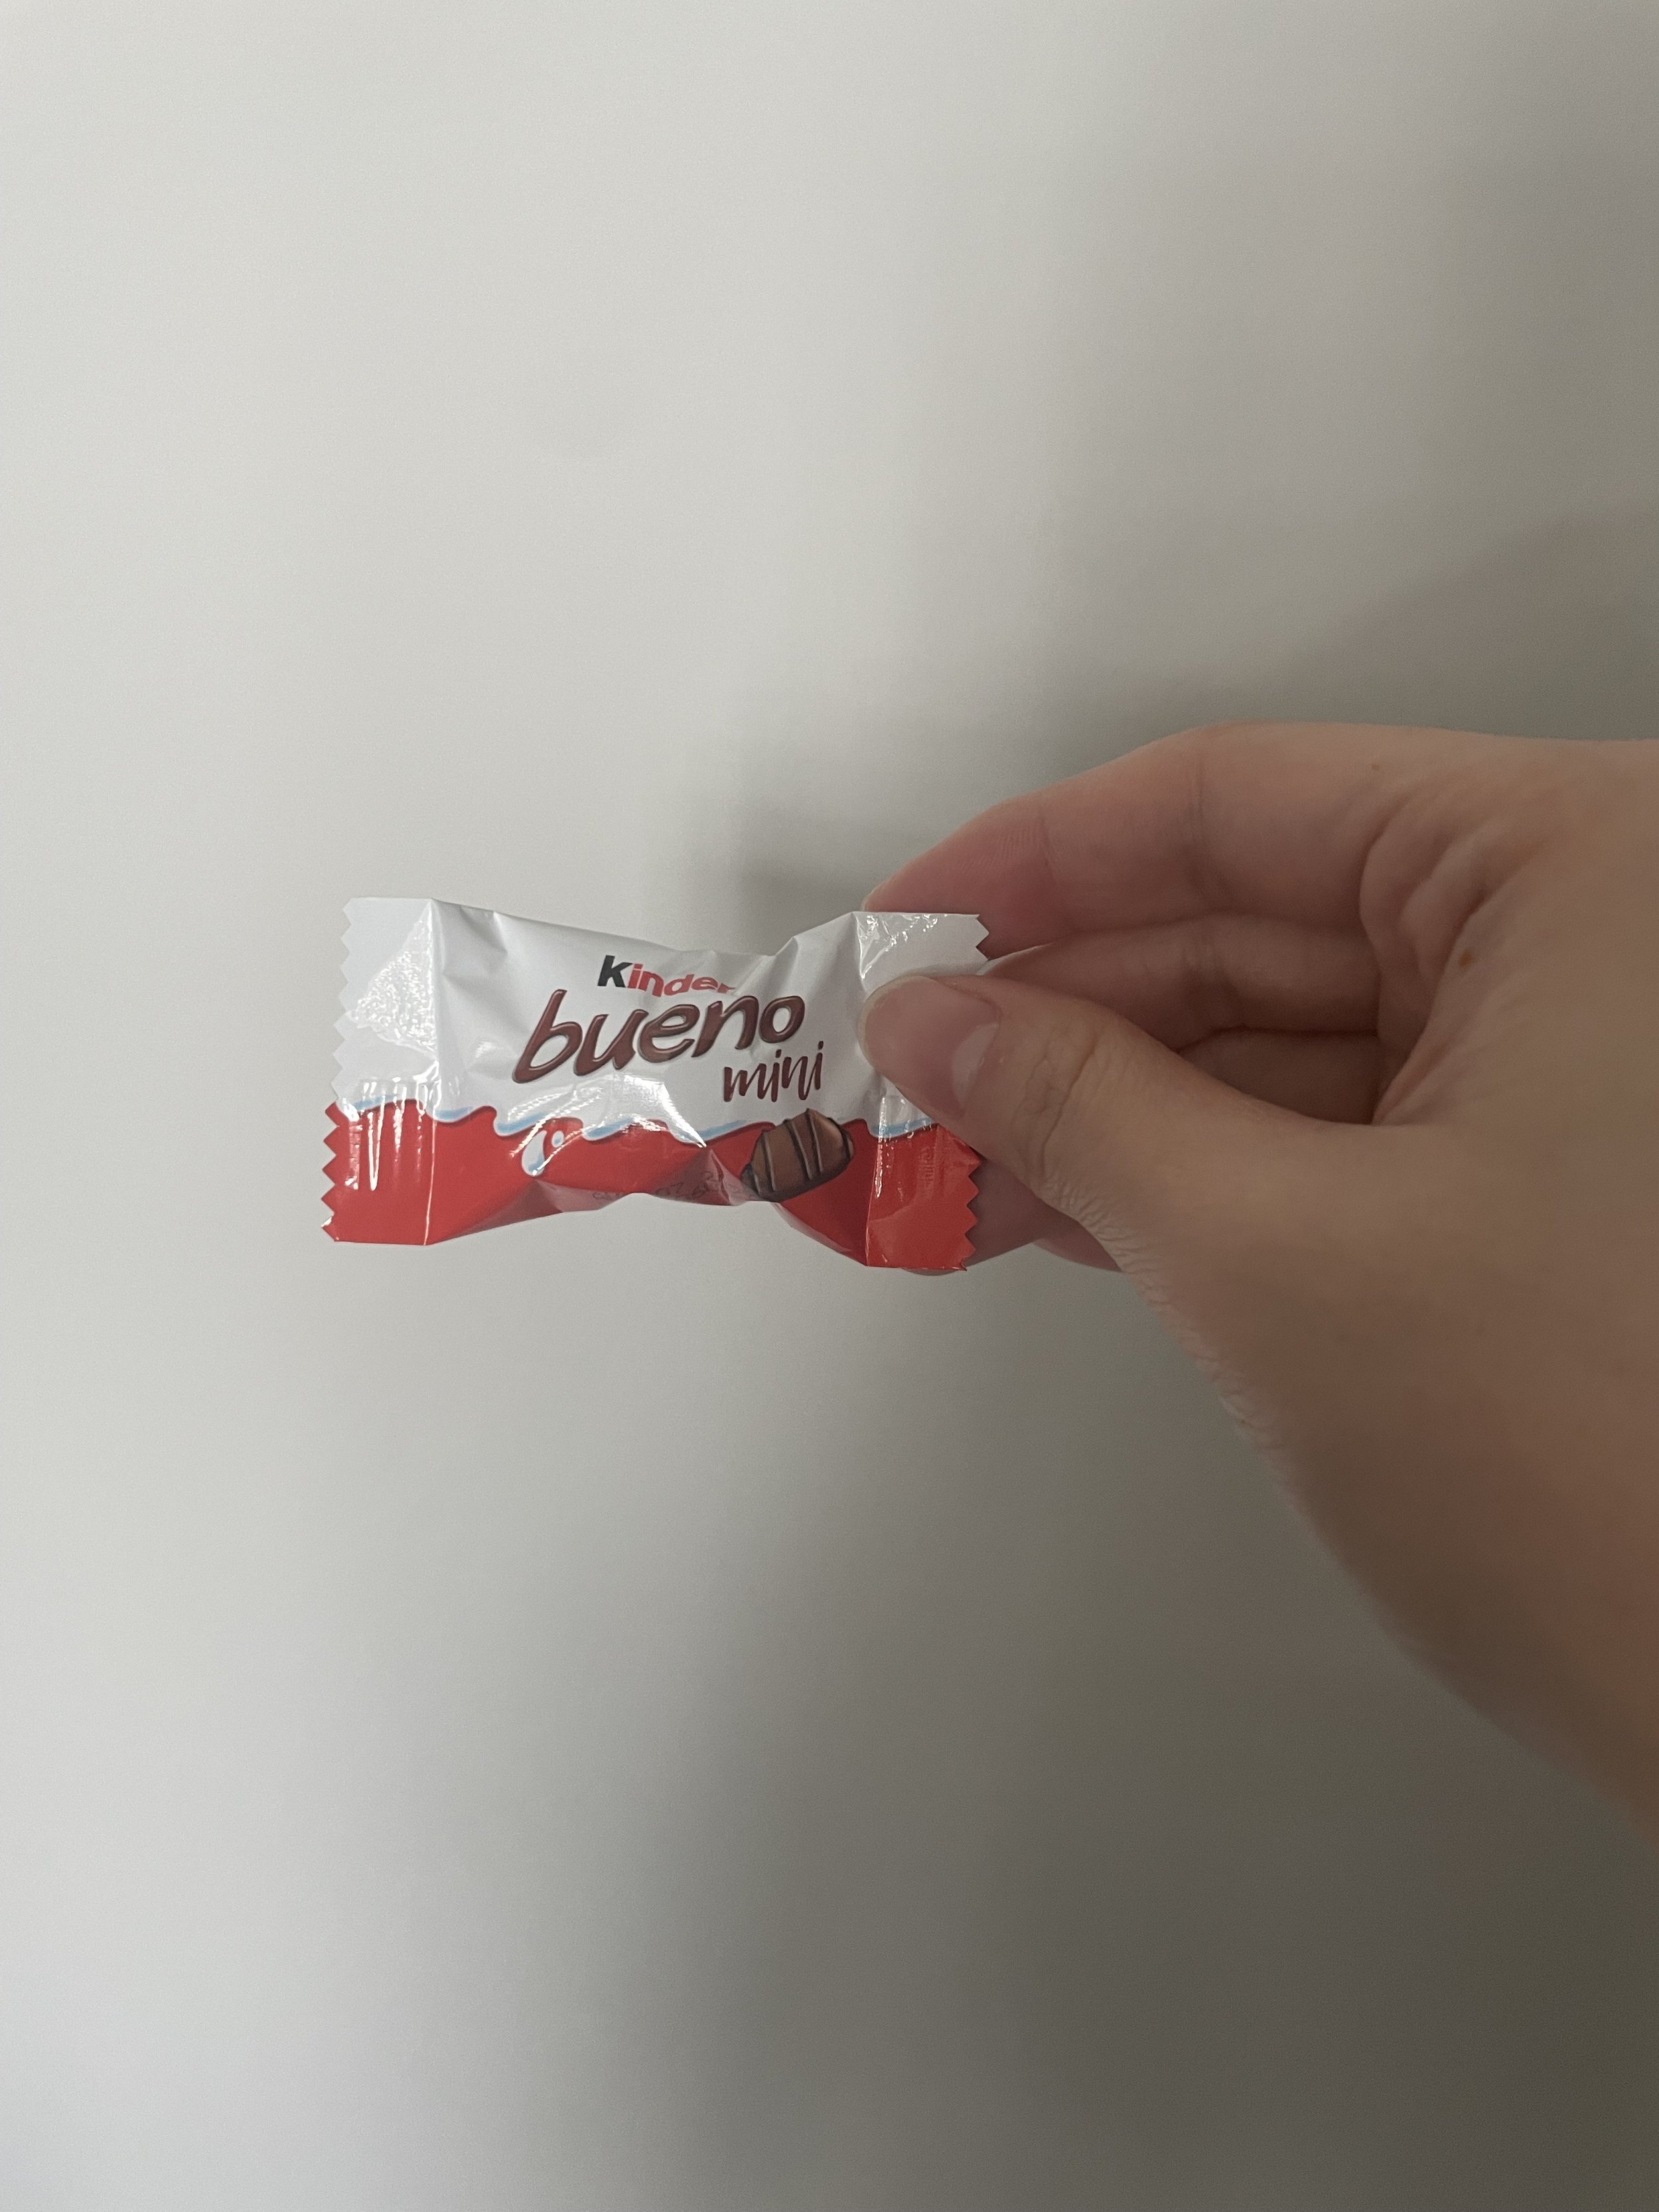

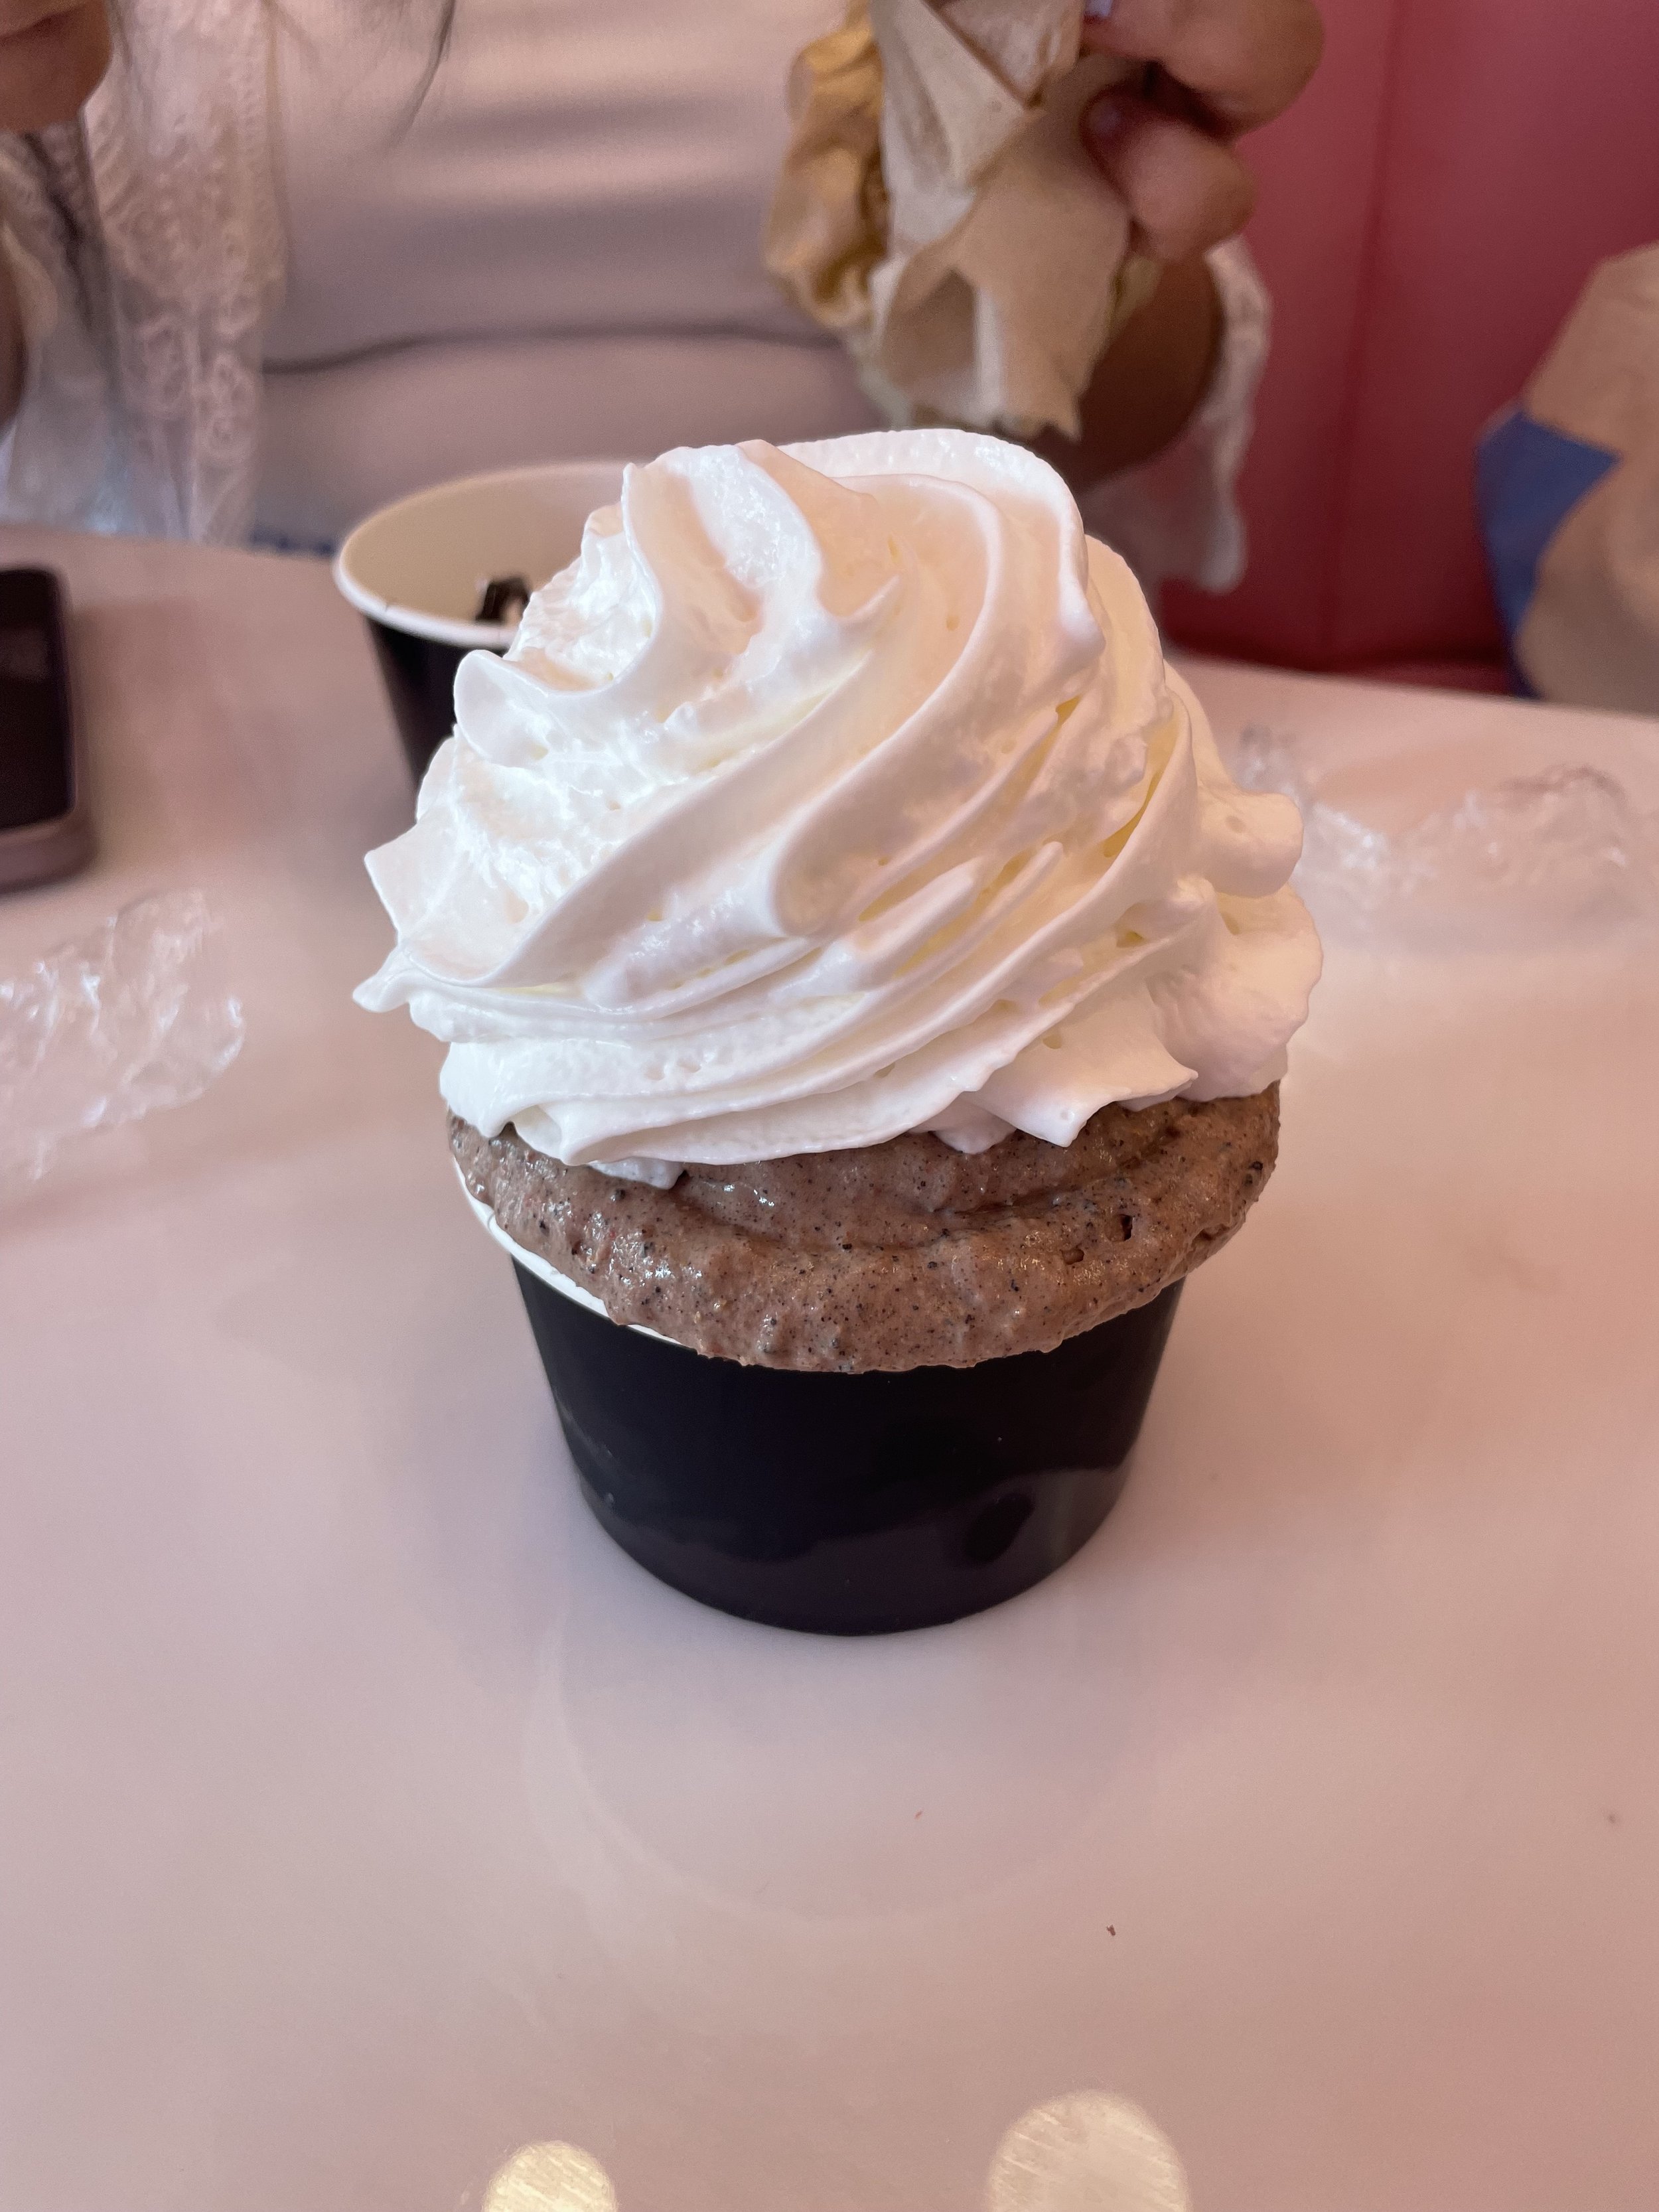


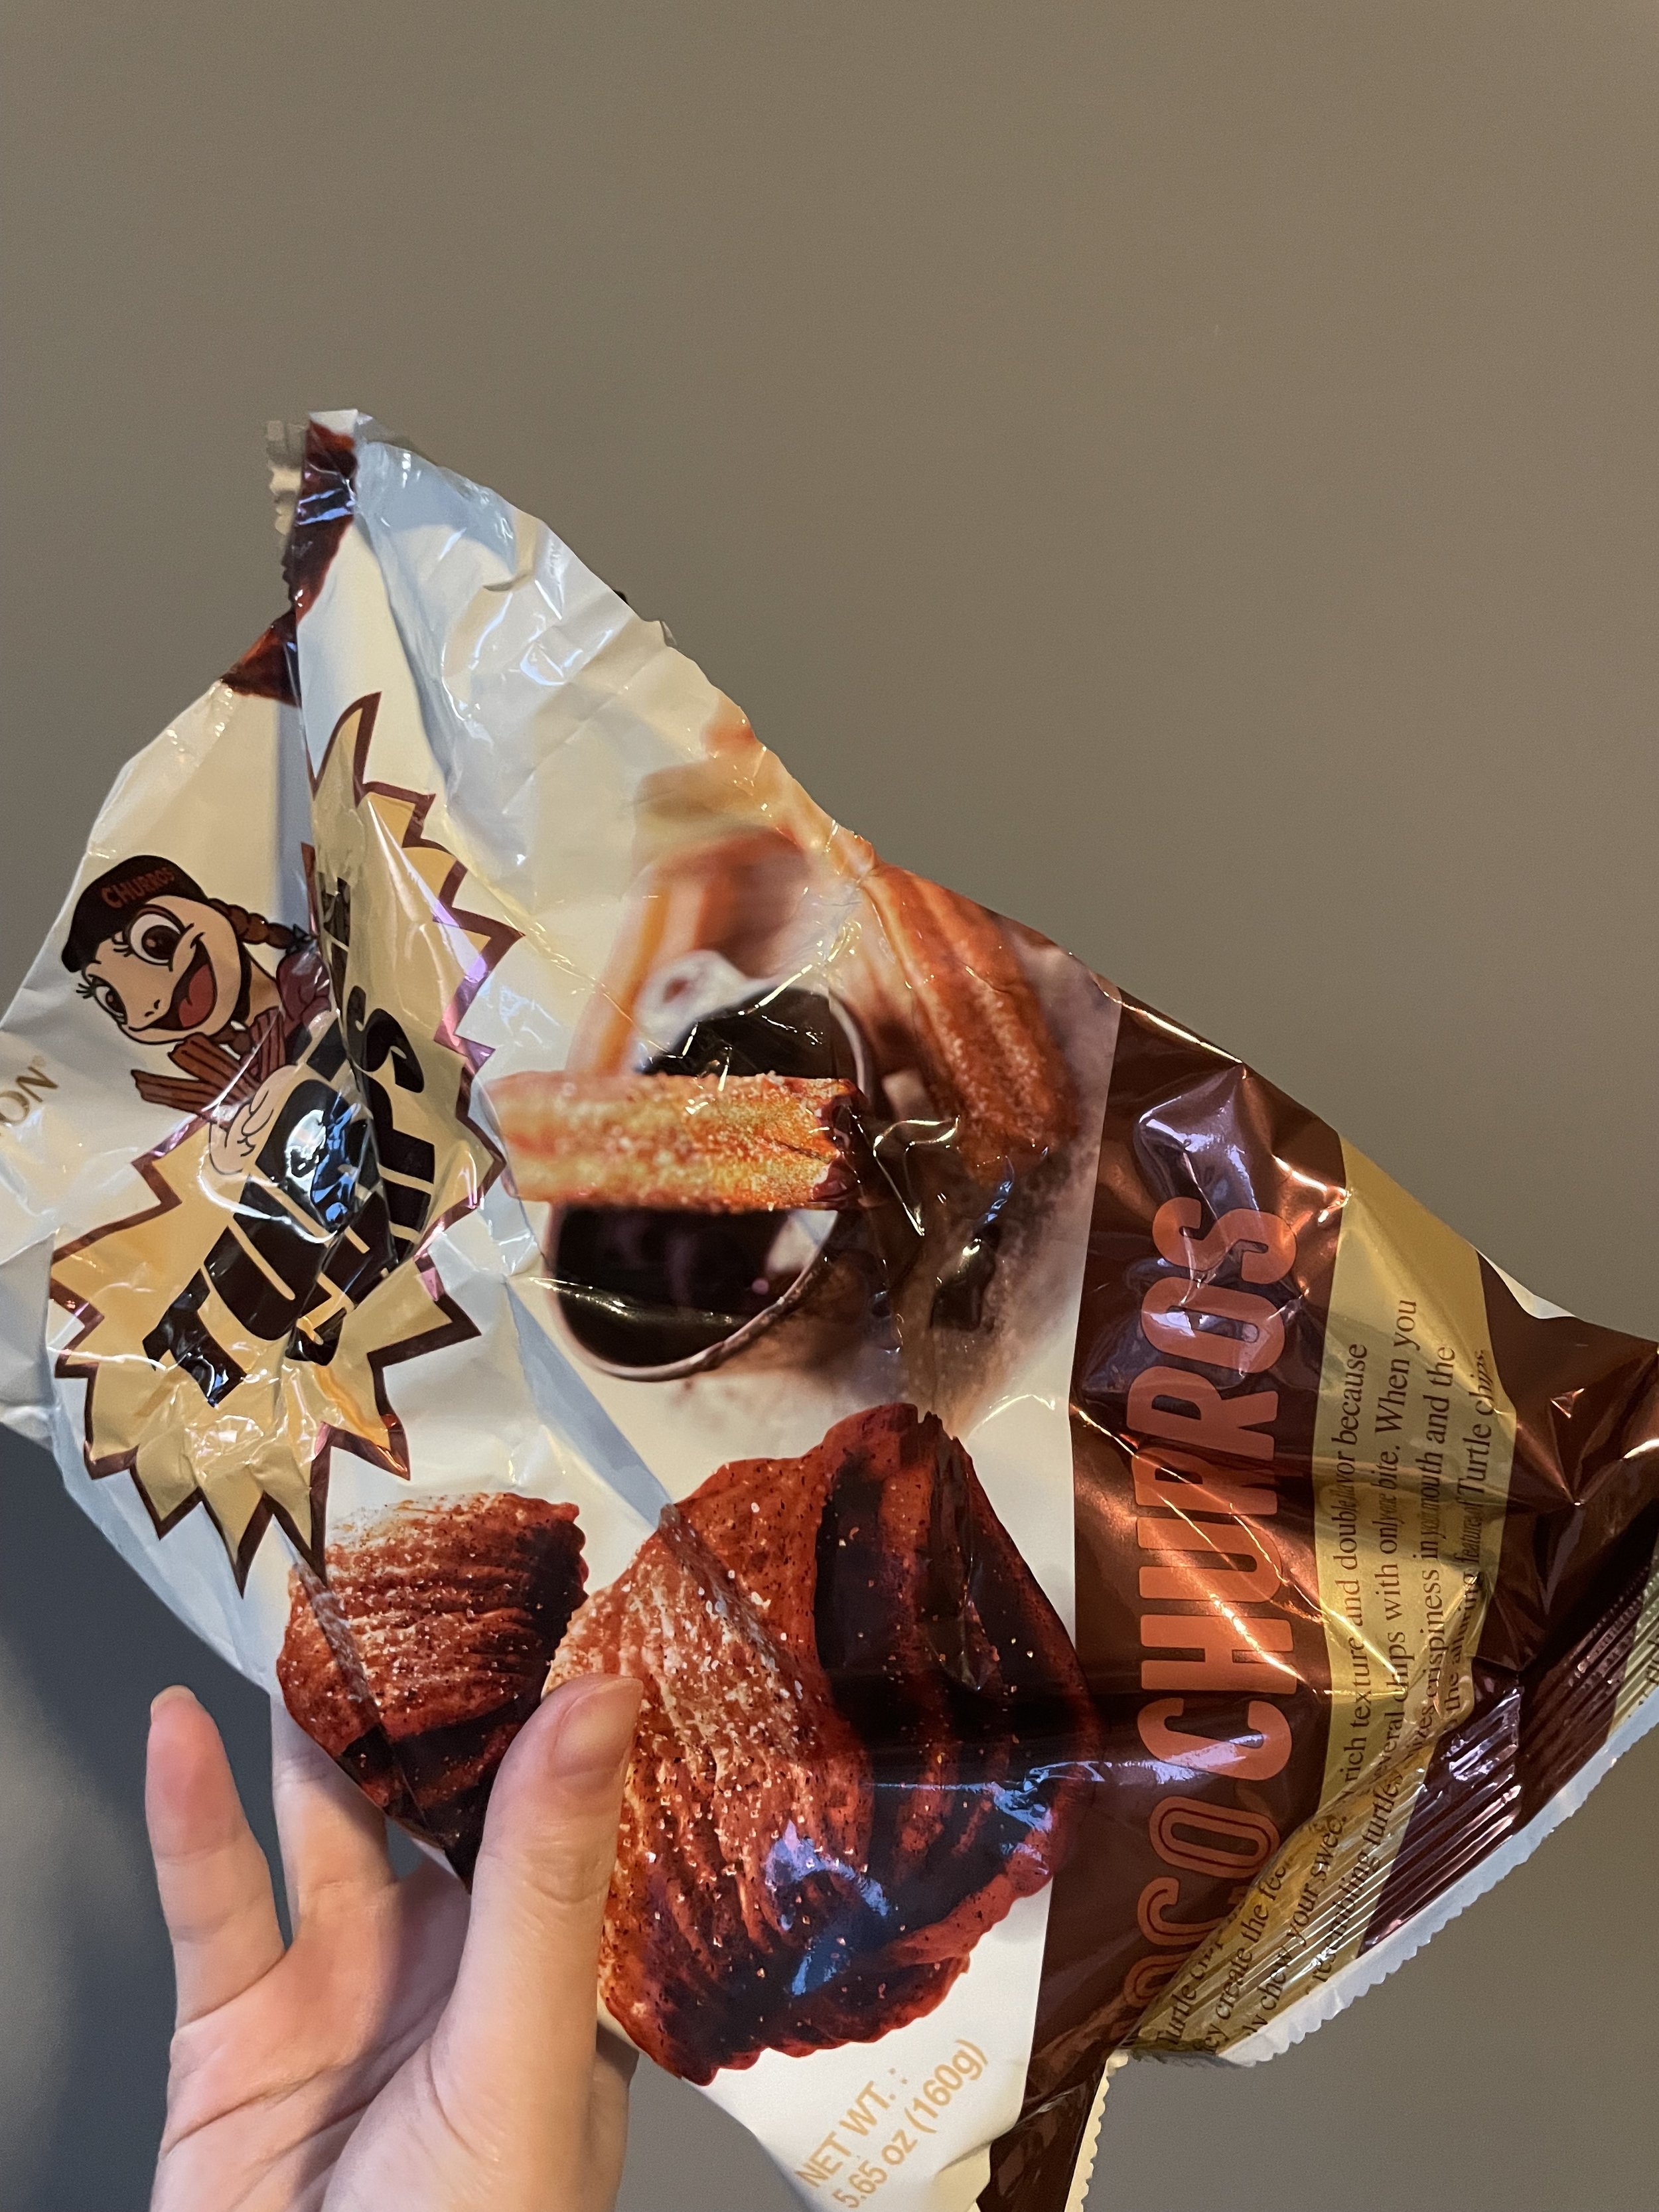
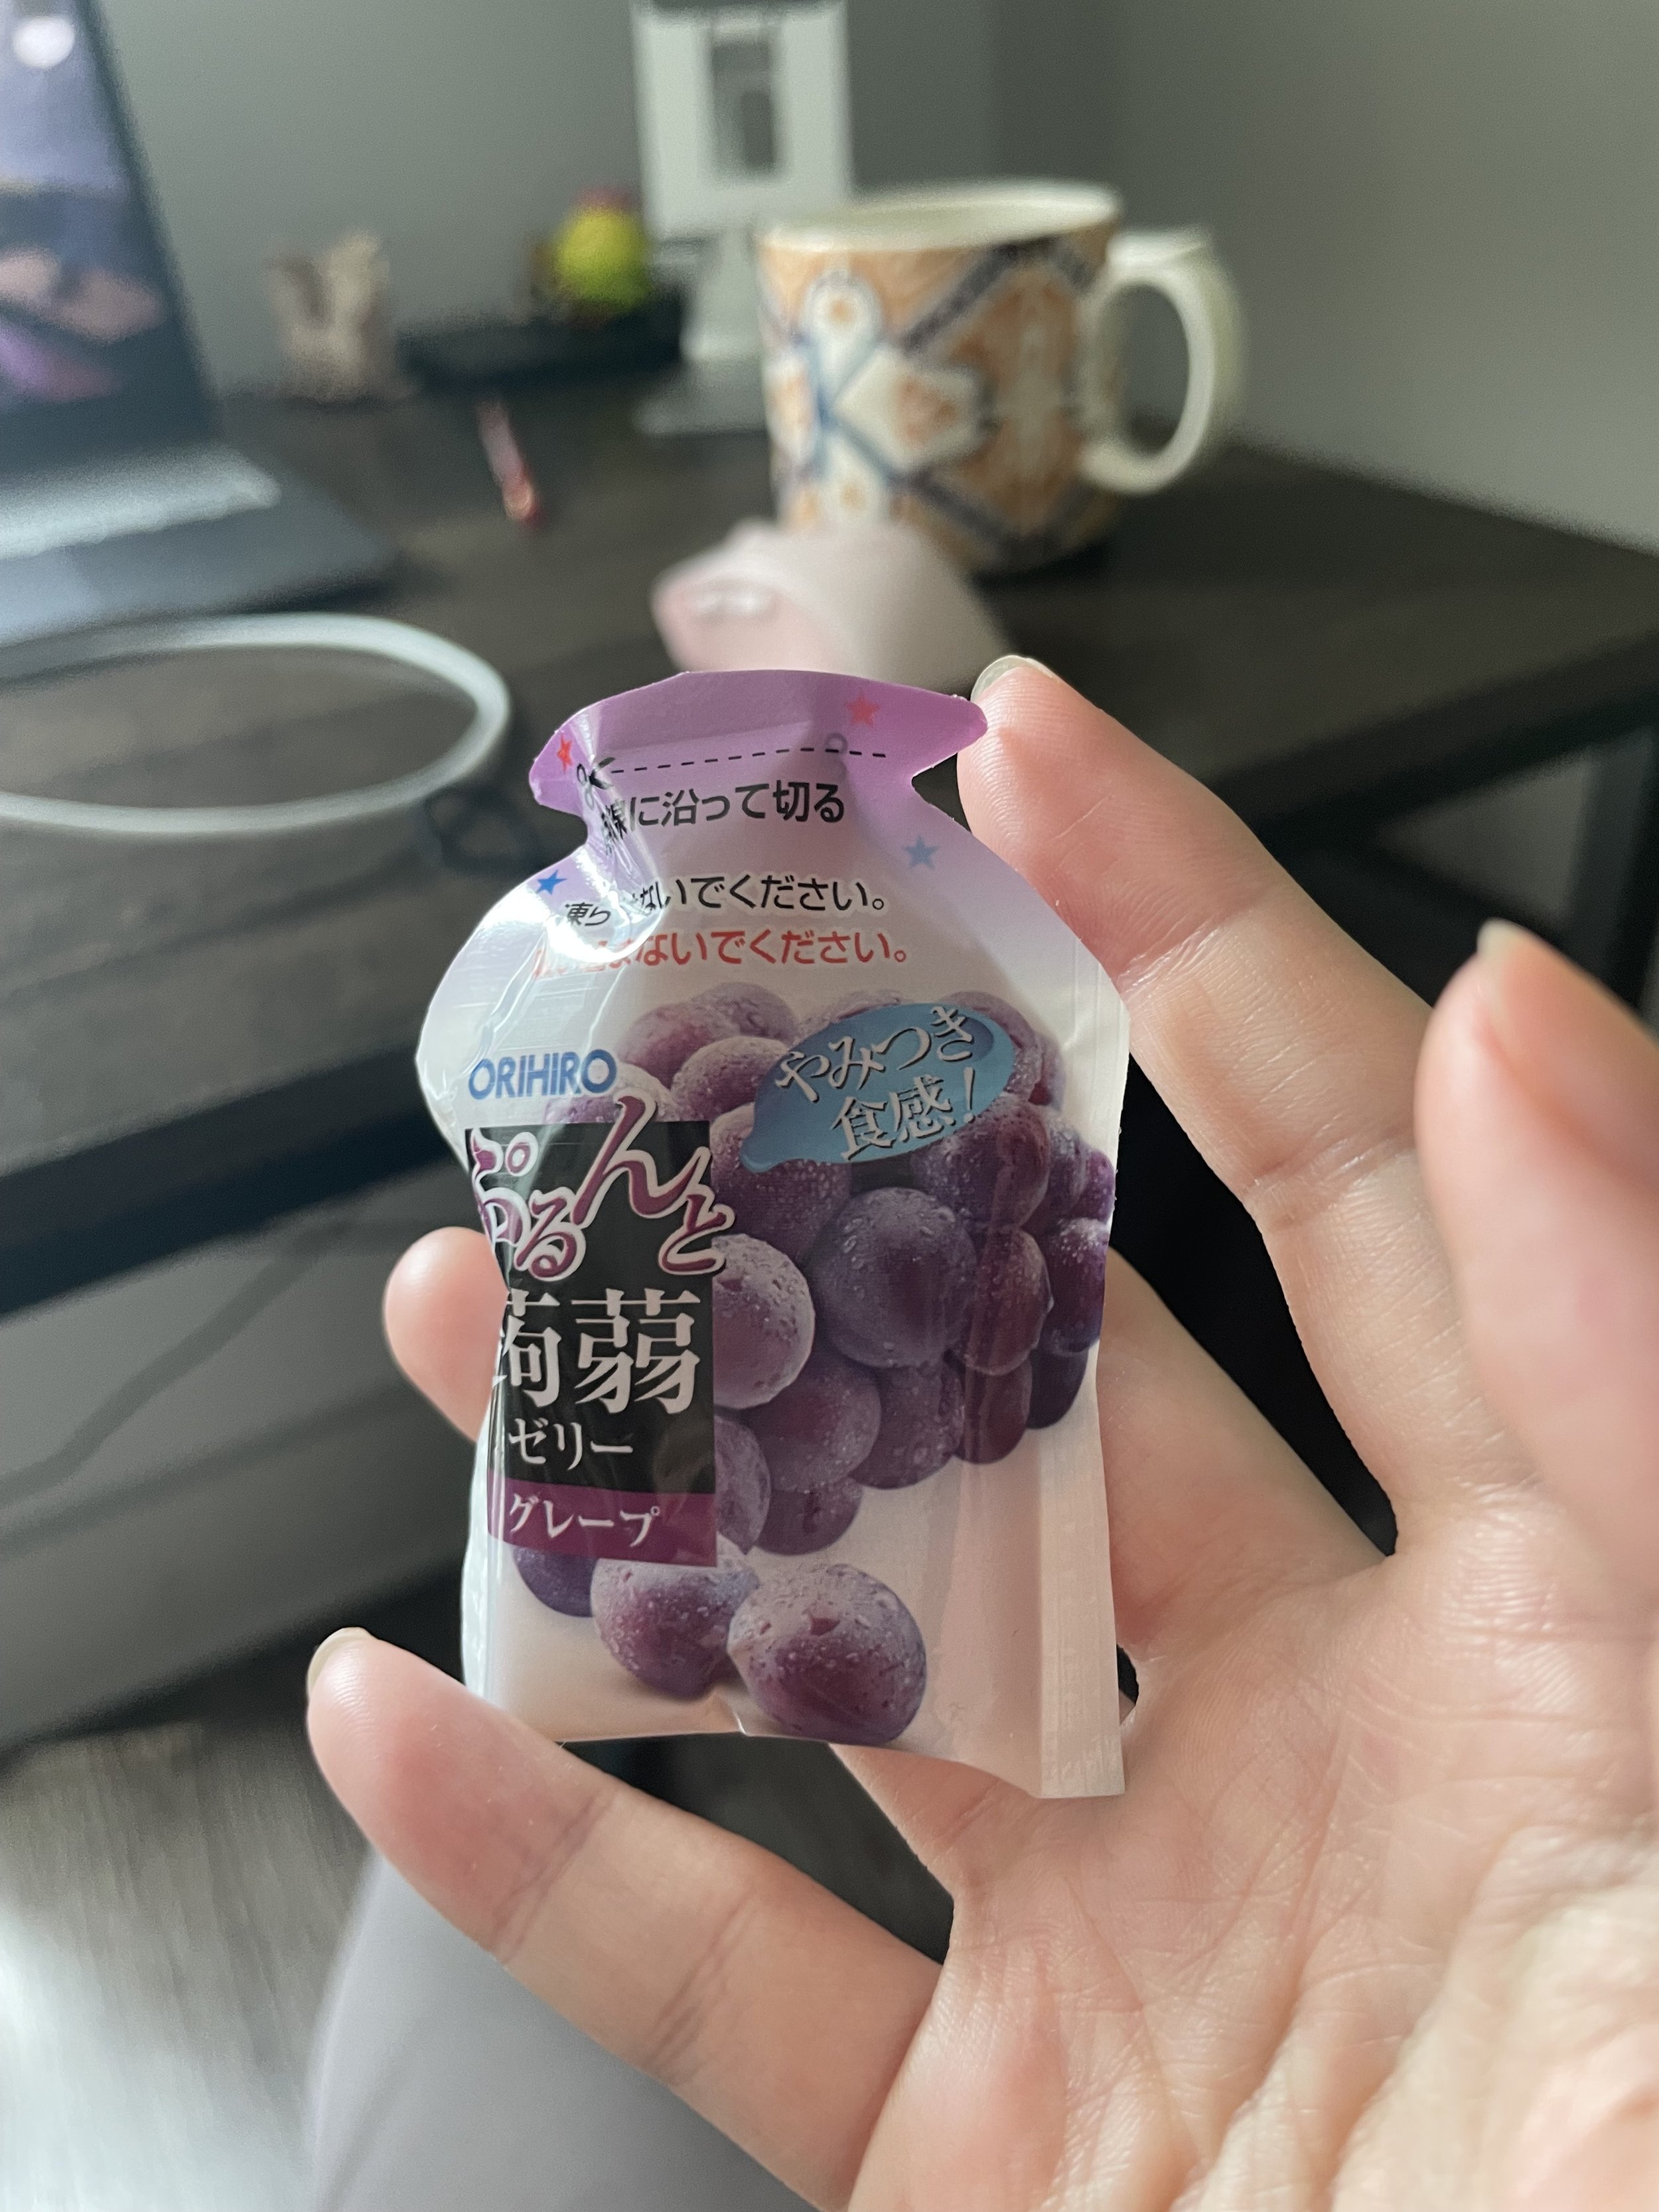
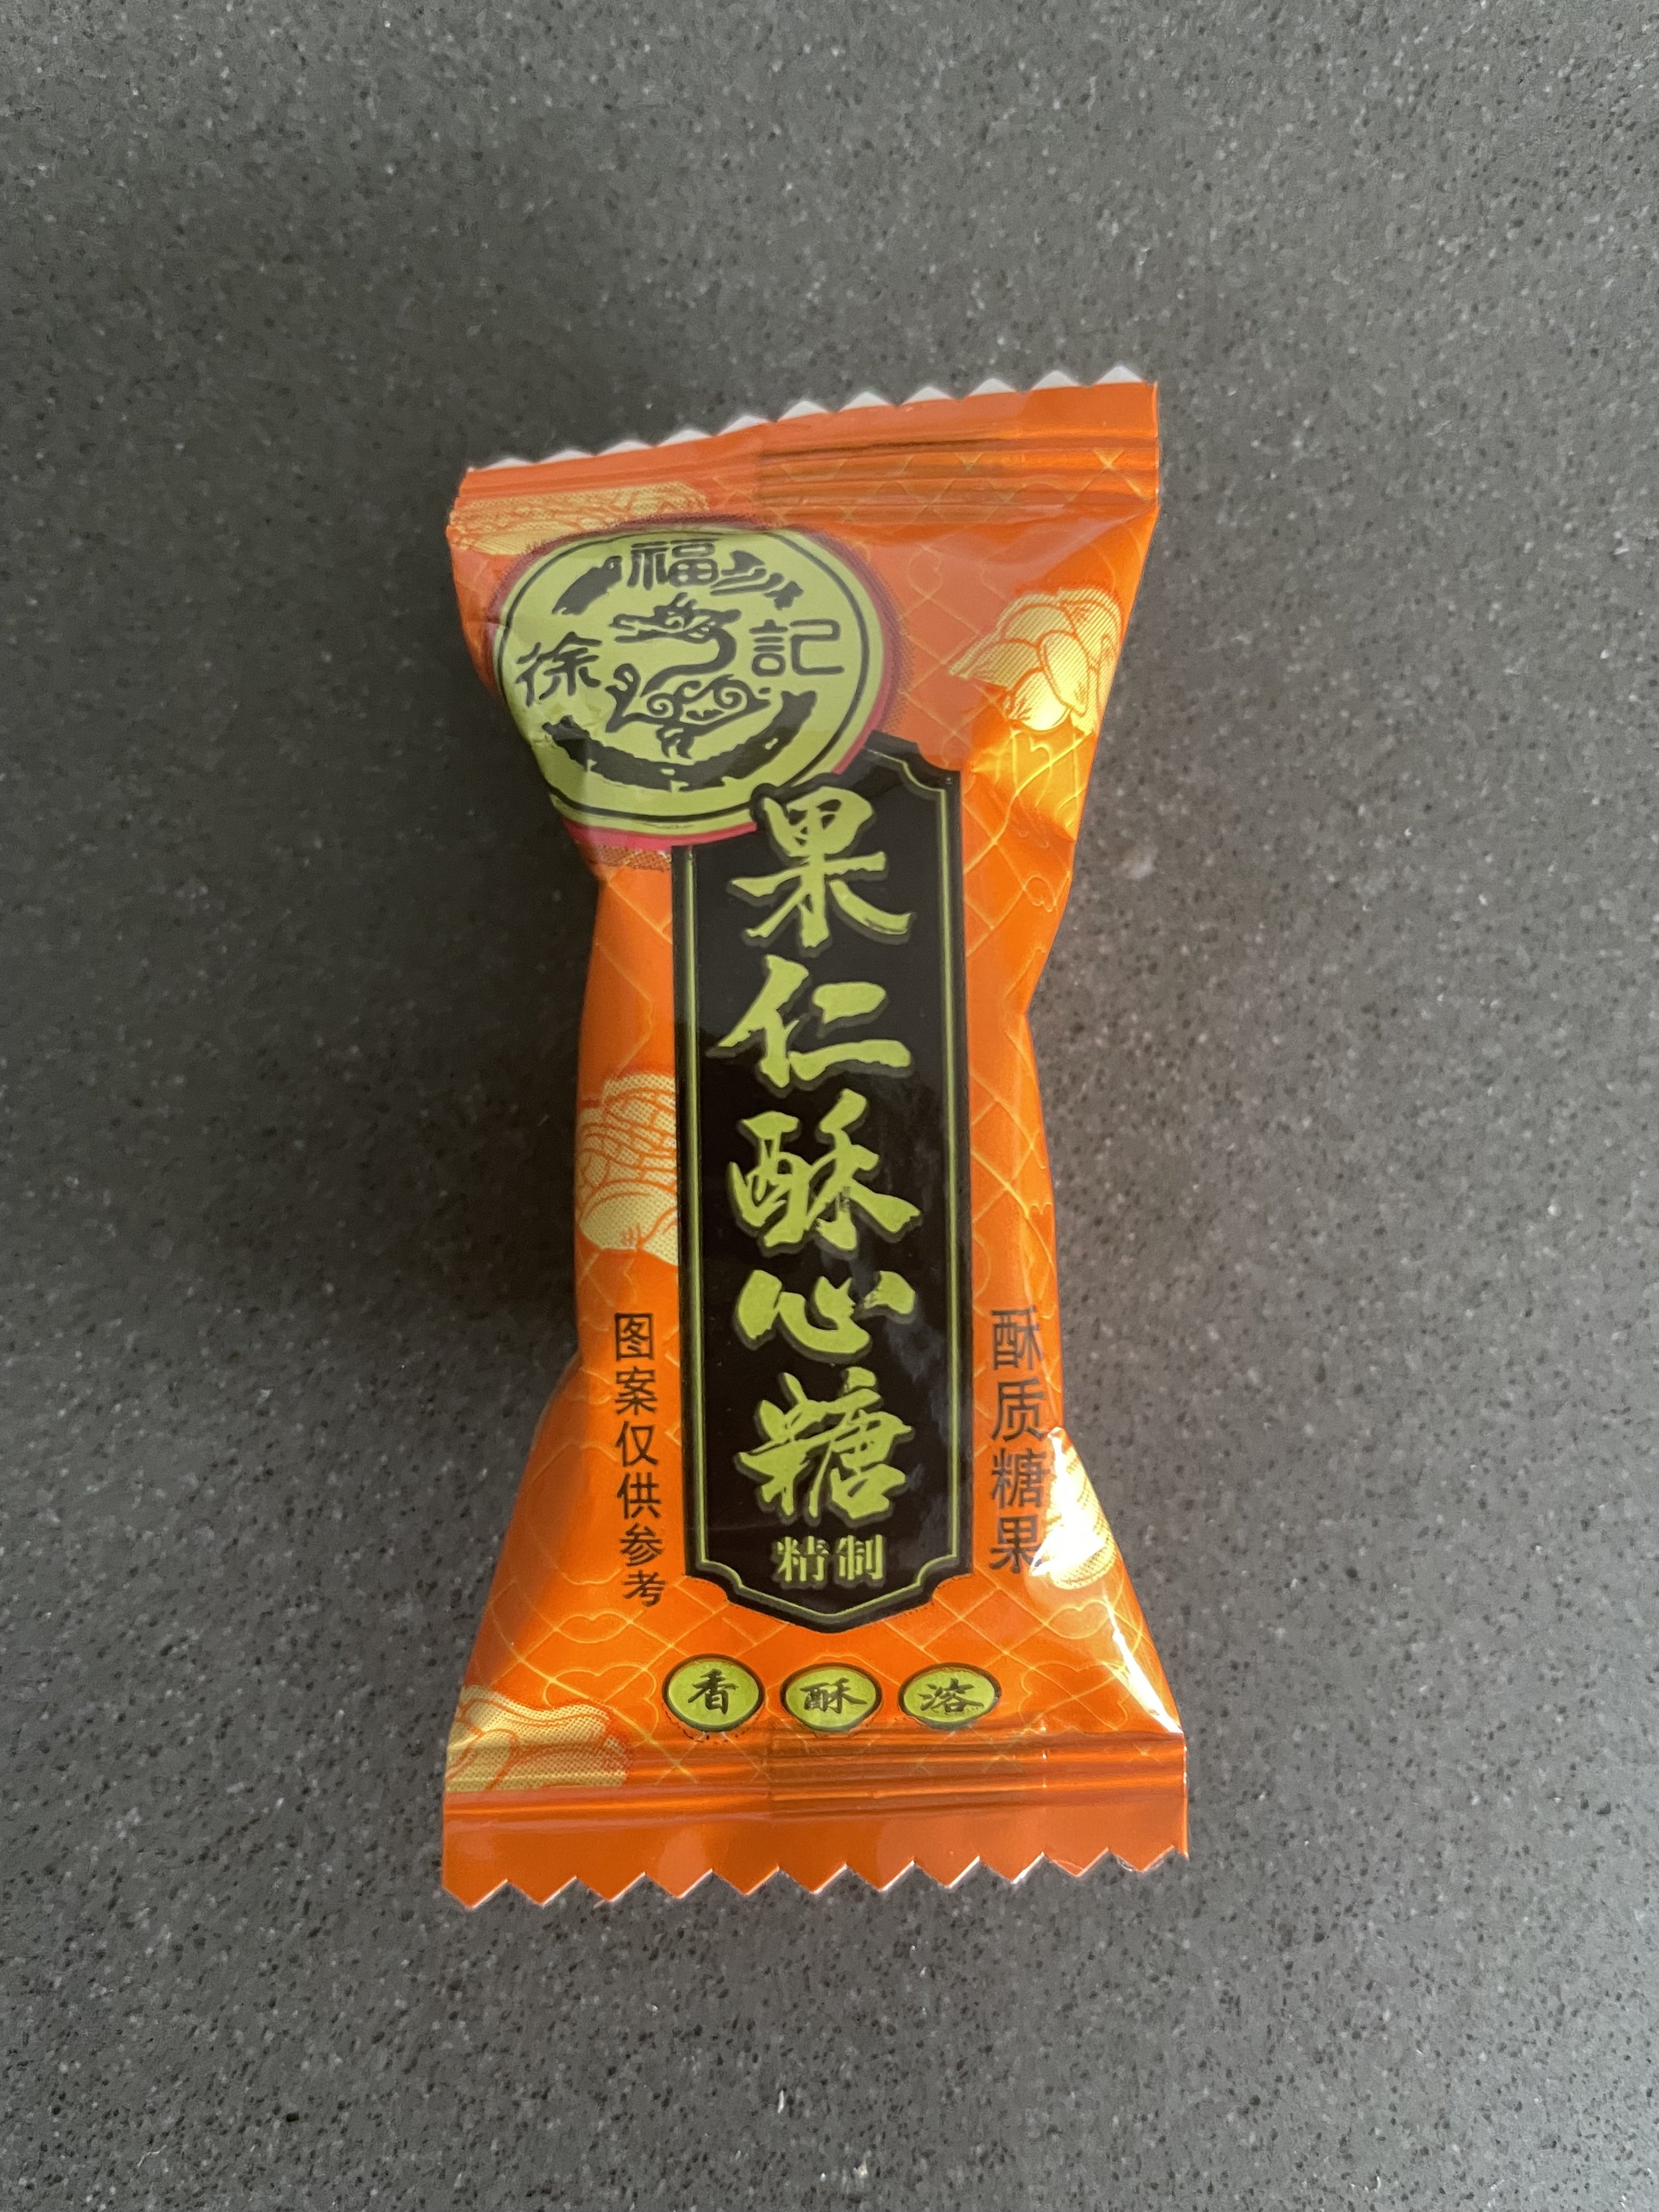

Throughout a 40-day period, I recorded every sweet food I ate with other related data like the type of food, amount, time, and motivations to reach sweet food, etc. to investigate their potential correlations.
Collecting Sugary Data

Color Code:
Data Visualization


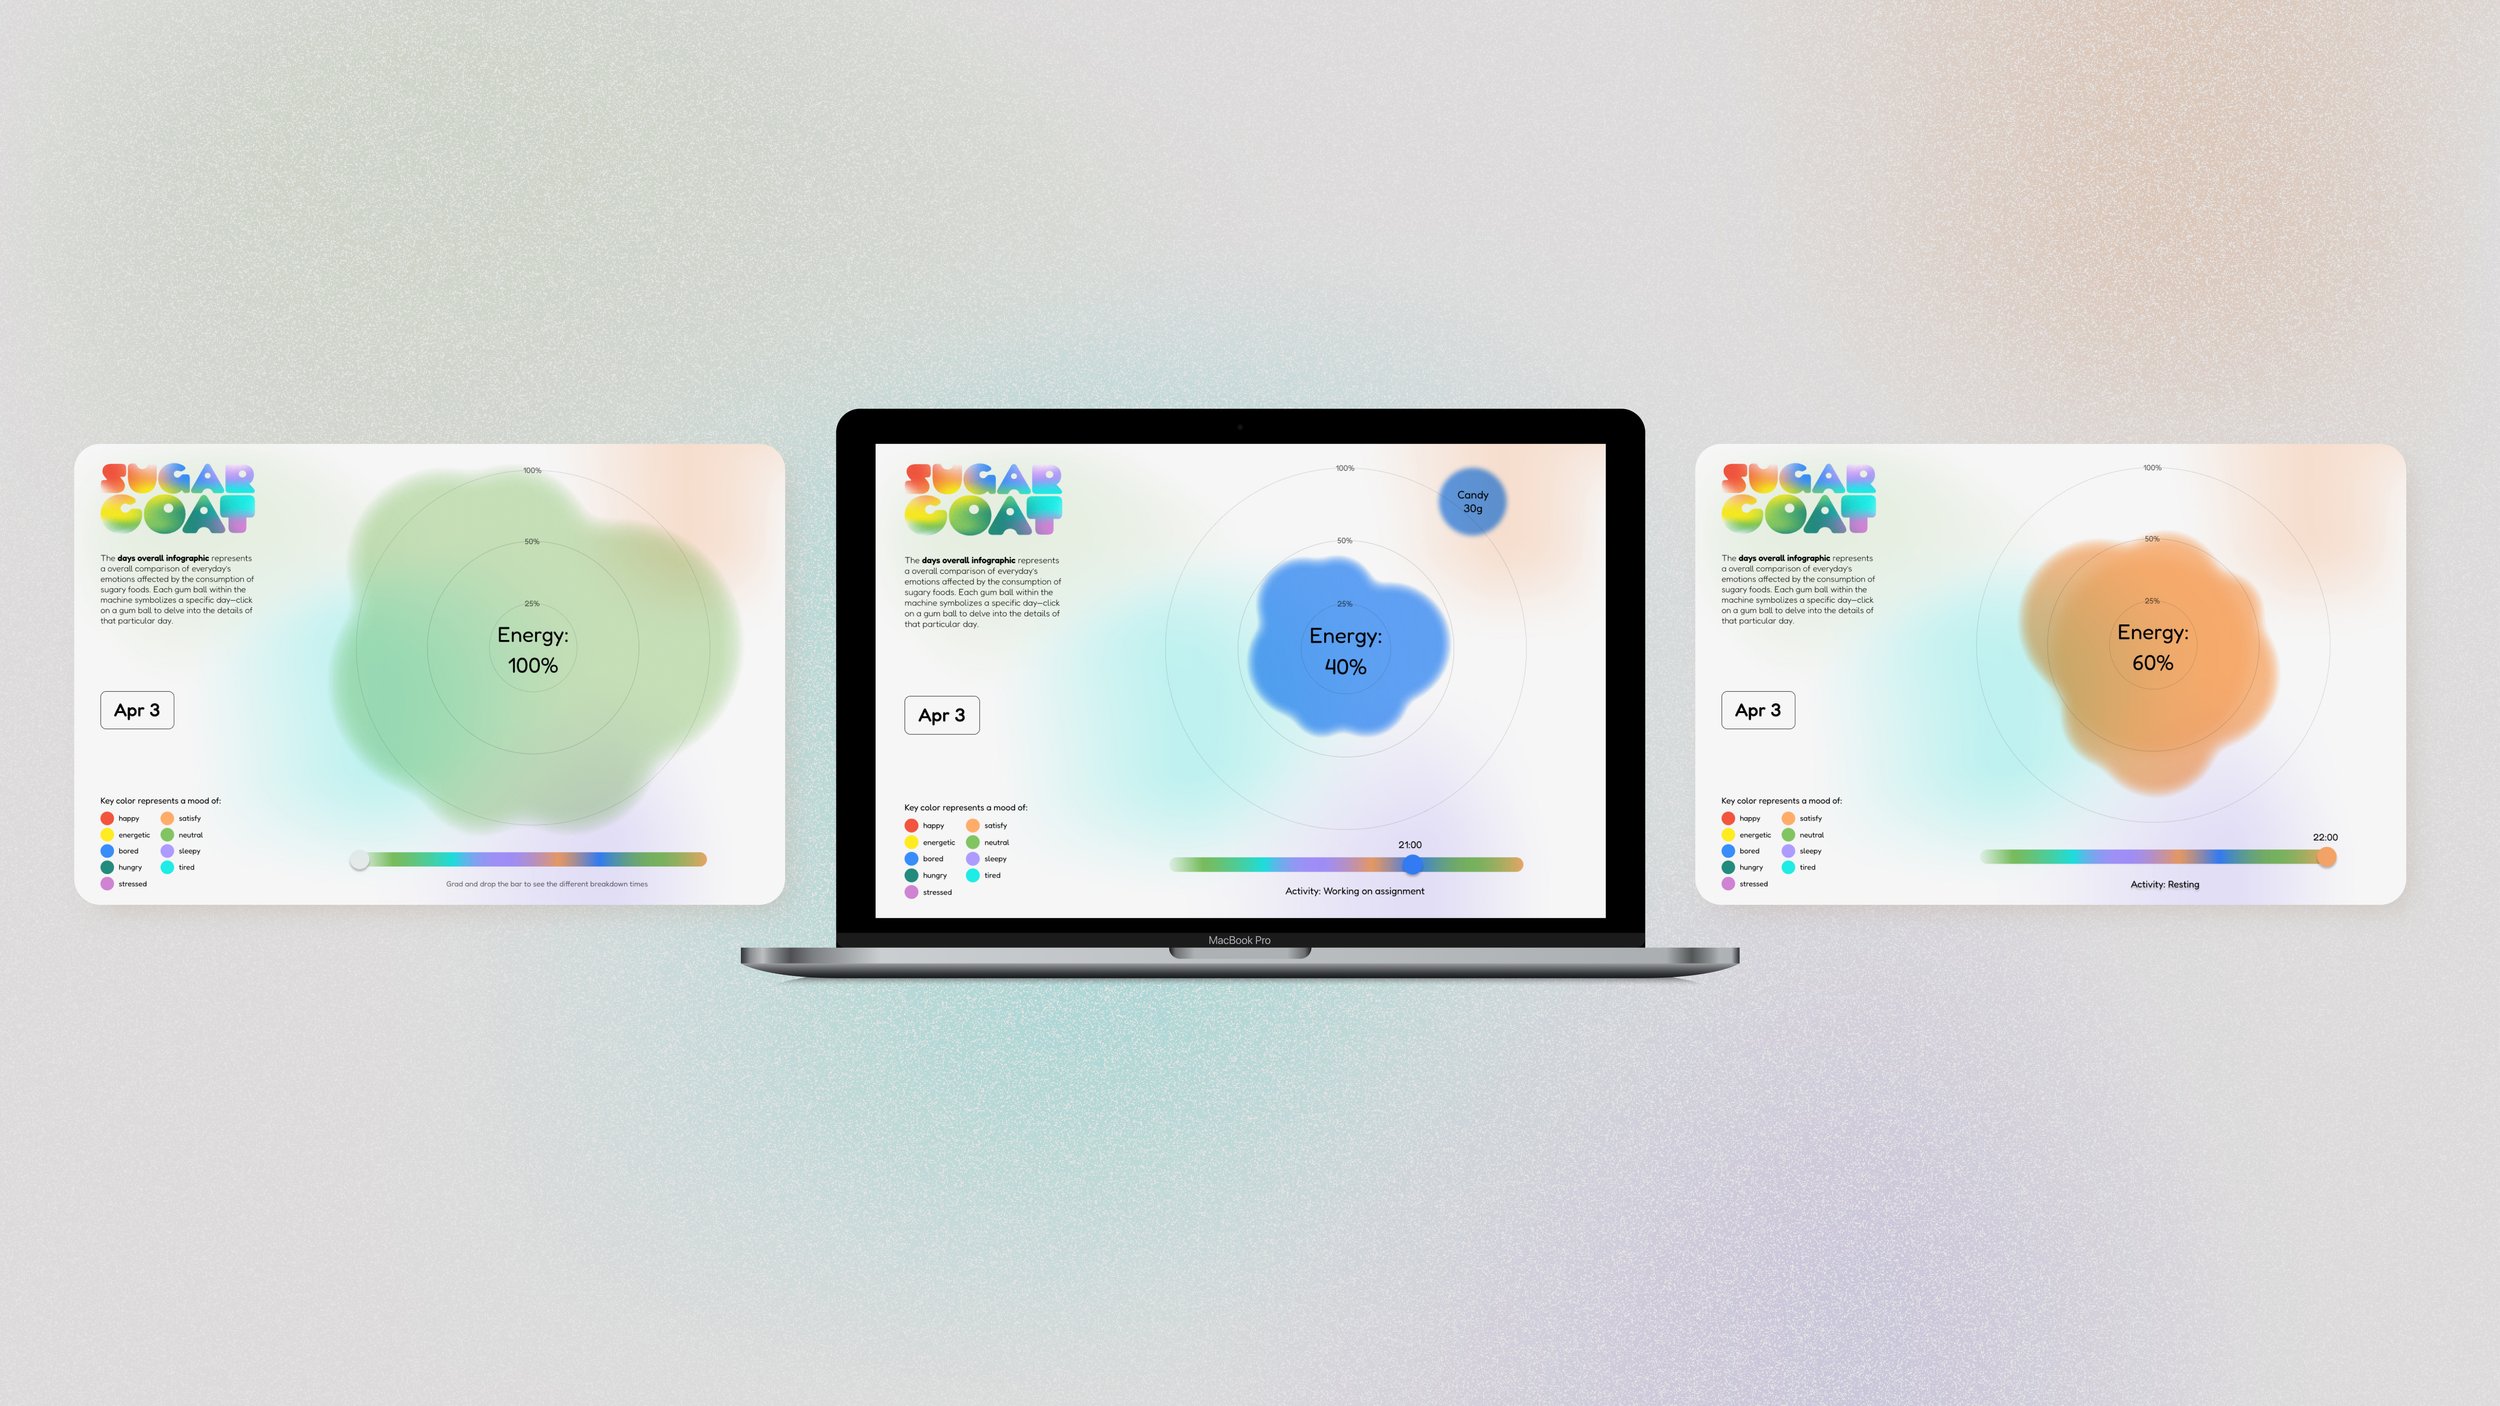
Each day is represented by a gumball that records all the emotions affected by consuming sugary food.


Days Overview
Affection Infographic
The affection infographic represents an overall comparison and shows my top 5 favorite sweets. Hover over each small gum ball to see the image of that particular sweet.
An overall comparison of everyday emotions affected by the consumption of sugary foods. Each gum ball within the machine symbolizes a specific day—click on a gum ball to delve into the details of that particular day.
Consumption Infographic
An overall comparison of the total and average everyday consumption of sugary foods. Each gumball symbolizes the amount of a specific day.

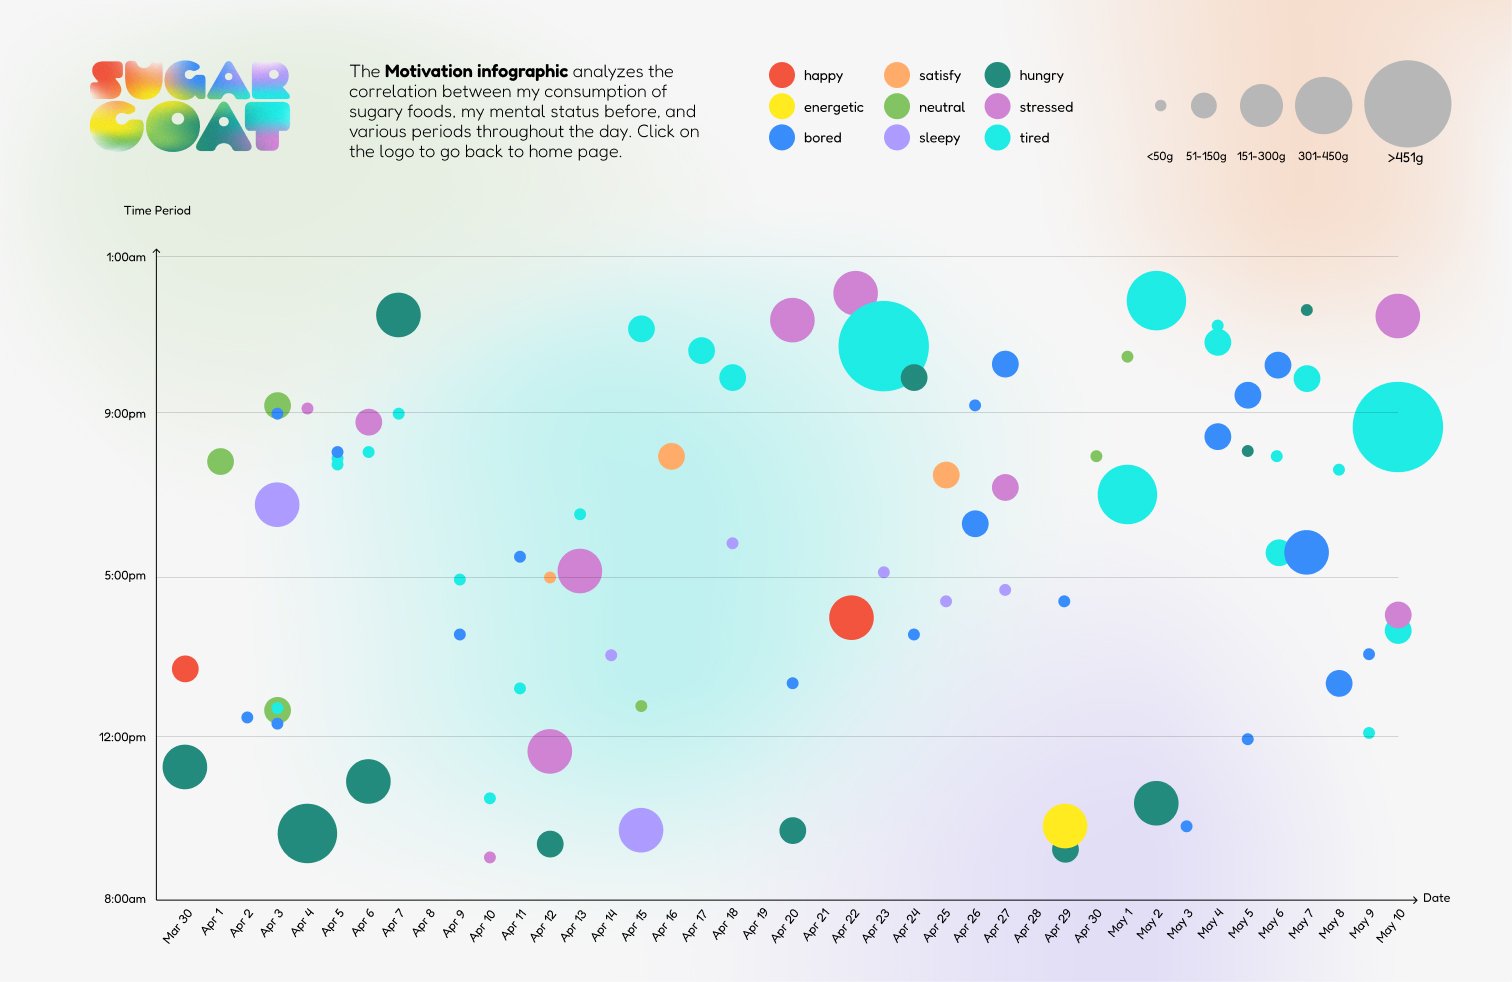
Motivation infographic
Analyzes the correlation between my consumption of sugary foods, my mental status before, and various periods throughout the day. Click on the logo to go back to the home page.